Weinreb et al., 2020 Datasets (LARRY)
Lineage tracing on transcriptional landscapes links state to fate during differentiation
[12]:
import scanpy as sc
import numpy as np
import operator
import pandas as pd
import torch.nn.functional as F
import torch.nn as nn
import scanpy as sc
import matplotlib.pyplot as plt
import torch
import os
from torch.nn import DataParallel
import os
import anndata as ad
import cospar as cs
import scanpy as sc
def createFig(figsize=(8, 4)):
    fig,ax=plt.subplots()
    ax.spines['right'].set_color('none')
    ax.spines['top'].set_color('none')
    #ax.spines['bottom'].set_color('none')
    #ax.spines['left'].set_color('none')
    for line in ax.yaxis.get_ticklines():
        line.set_markersize(5)
        line.set_color("#585958")
        line.set_markeredgewidth(0.5)
    for line in ax.xaxis.get_ticklines():
        line.set_markersize(5)
        line.set_markeredgewidth(0.5)
        line.set_color("#585958")
    ax.set_xbound(0,10)
    ax.set_ybound(0,10)
    fig.set_size_inches(figsize)
    return fig,ax
def setPltLinewidth(linewidth:float):
    mpl.rcParams['axes.linewidth'] = linewidth
import matplotlib as mpl
fig,ax=createFig()
fig.set_size_inches(5,5)
mpl.rcParams['pdf.fonttype'] = 42
mpl.rcParams['ps.fonttype'] = 42
setPltLinewidth(1)
plt.rcParams['figure.dpi'] = 300
plt.rcParams['savefig.dpi'] = 300
plt.rcParams['font.size'] = 14
plt.rcParams['axes.linewidth'] = 1
##setting draw parameters
[35]:
adata.obsm['X_clone']
[35]:
<49116x5864 sparse matrix of type '<class 'numpy.bool_'>'
        with 49116 stored elements in Compressed Sparse Row format>
[13]:
def ScanpyVolcanoPlot(adata, axis, use_adjusted_p=True, show_label=True, label_fold_change=2, label_log_p=80, add_grid=True, label_size=4, filter_labels=None, kept_labels=None, color1='#F09D30', color2='#3D5FA6', label_excludes=None):
    fig, ax = createFig()
    log2foldchanges = list(map(lambda x: x[axis], adata.uns['rank_genes_groups']['logfoldchanges']))
    if use_adjusted_p:
        log10adjp = -np.log10(list(map(lambda x: x[axis], adata.uns['rank_genes_groups']['pvals_adj'])))
    else:
        log10adjp = -np.log10(list(map(lambda x: x[axis], adata.uns['rank_genes_groups']['pvals'])))

    ax.scatter(
        x=log2foldchanges,
        y=log10adjp,
        s=12,
        alpha=0.8,
        linewidth=0,
        c=list(map(lambda x: color2 if abs(x[0]) > label_fold_change and x[1] > label_log_p and x[0] < 0
                   else color1 if abs(x[0]) > label_fold_change and x[1] > label_log_p and x[0] > 0
                   else 'gray', zip(log2foldchanges, log10adjp)))
    )
    if add_grid:
        ax.axvline(-label_fold_change, color ="black", alpha = 0.8, lw = 0.8, ls='--')
        ax.axvline(label_fold_change, color ="black", alpha = 0.8, lw = 0.8, ls='--')
        ax.axhline(label_log_p, color ="black", alpha = 0.8, lw = 0.8, ls='--')
        ax.grid(alpha=0.4)
    if show_label:
        indices = list(map(lambda x: abs(x[0]) > label_fold_change and x[1] > label_log_p, zip(log2foldchanges, log10adjp)))
        for i, j, s in zip(np.array(log2foldchanges)[indices], np.array(log10adjp)[indices], list(map(lambda x: x[1], adata.uns['rank_genes_groups']['names'][indices]))):
            if label_excludes is not None and s in label_excludes:
                continue
            if filter_labels is not None and s in filter_labels:
                continue
            if kept_labels is not None and s not in kept_labels:
                continue
            ax.text(i, j, s=s, size=label_size)

    return fig, ax
[26]:
adata=cs.hf.read("./2.2_weinreb_forziwei.h5ad")
import pickle
f_read = open('./dic_fate_weinreb_ourmodel_allundiff.pkl', 'rb')
a = pickle.load(f_read)
f_read = open('./dic_true_weinreb.pkl', 'rb')
b = pickle.load(f_read)
adata.obs['fate_pred']=None
adata.obs['fate_pred']=adata.obs['index'].map(a)
adata.obs['GT']=None
adata.obs['GT']=adata.obs['index'].map(b)
[36]:
f_read = open('/home/zhengtuo/songtao/DestinyNet/weinreb_2.22_fate_and_prob/dic_fate_weinreb_ourmodel.pkl', 'rb')
a = pickle.load(f_read)
adata.obs['fate_pred']=None
adata.obs['fate_pred']=adata.obs['index'].map(a)
[38]:
adata.obs['GT'].value_counts()#0: 1633, 1: 1761, 2: 271
[38]:
1.0    1761
0.0    1633
2.0     271
Name: GT, dtype: int64
[21]:
adata[adata.obs['time_info'].isin([2,4])].obs['state_info'].value_counts()
[21]:
undiff        11717
Neutrophil     2831
Monocyte       2571
Baso           1545
Meg             310
Mast            283
Lymphoid        115
Erythroid        83
Eos              36
pDC              32
Ccr7_DC          24
Name: state_info, dtype: int64
[5]:
weinreb_adata_raw = sc.read_h5ad("/home/zhengtuo/songtao/DestinyNet/weinreb.h5ad")
sc.pp.log1p(weinreb_adata_raw)
adata.raw = weinreb_adata_raw
[6]:
adata.obsm["X_tsne"] = sc.read_h5ad("/home/zhengtuo/songtao/DestinyNet/1.8_weinreb_forziwei.h5ad").obsm["X_emb_old"]
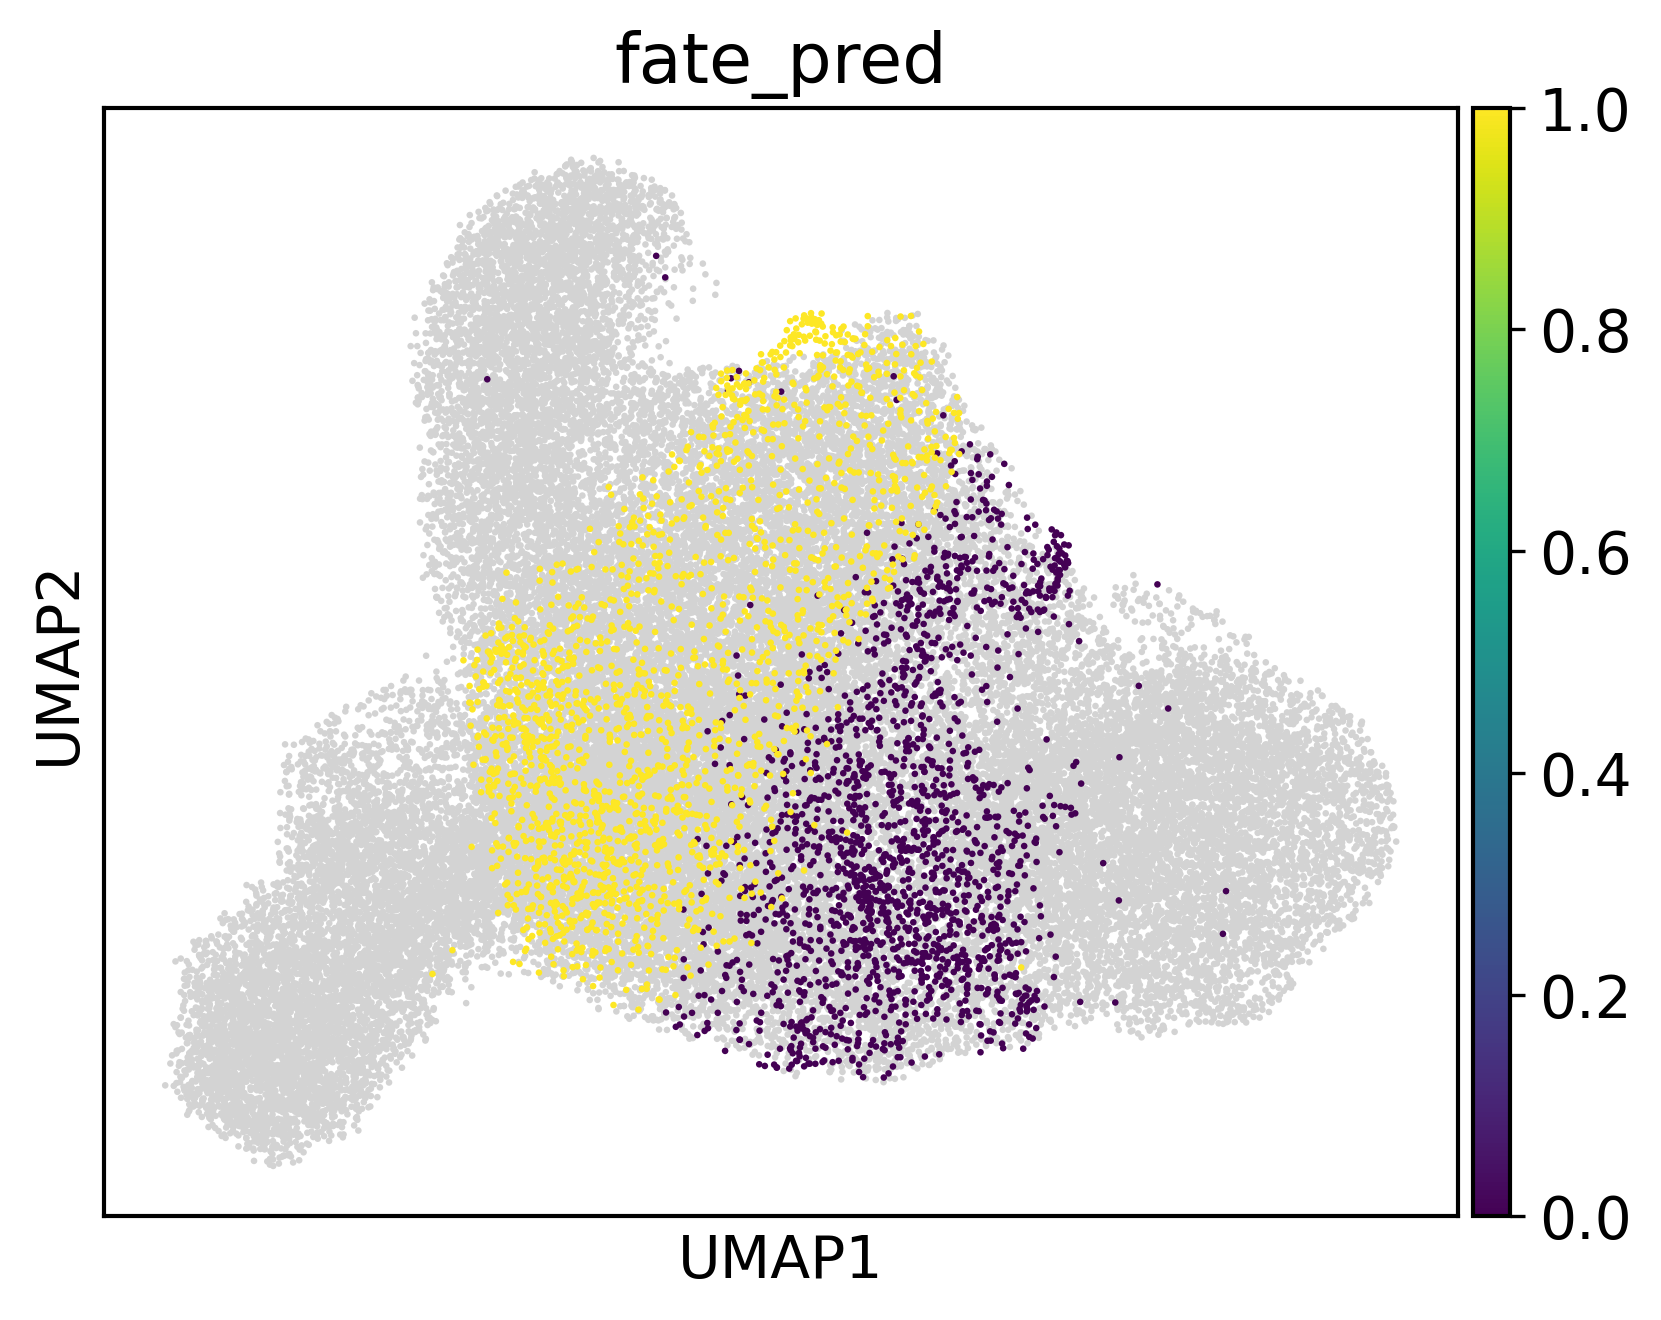
[7]:
sc.pl.umap(adata,color='fate_pred',s=10)
[15]:
###### from torch.utils.data import Dataset, DataLoader
import torch
import torch.nn as nn
import torch.nn.functional as F
import numpy as np
import random
from math import sqrt
from random import choice
from torch.utils.data  import Dataset, DataLoader
import pandas as pd
#from layers import SinkhornDistance
num_relations=8
len_geneExp=25289
len_embedding=256
learning_rate=0.0001
num_epoch=50
batchsize=512

criterion_rec = nn.MSELoss()
geneEnc=nn.Sequential(
        nn.Dropout(),
        nn.Linear(len_geneExp, 100),
        nn.ReLU(),
                nn.Linear(100, 100),
                nn.ReLU(),
         nn.Linear(100, 100),
                nn.ReLU(),
        nn.Linear(100, 100),
                nn.ReLU(),
        nn.Linear(100, len_embedding),
    )

geneDec = nn.Sequential(
    nn.Linear(len_embedding, len_geneExp),
    #nn.Linear(512, len_geneExp),
)
genemap = nn.Sequential(
     #nn.Dropout(),
     nn.Linear(len_embedding, 100),
     nn.BatchNorm1d(100),
    nn.ReLU(),
    nn.Linear(100, 100),
    nn.BatchNorm1d(100),
    nn.ReLU(),
    nn.Linear(100, 100),
    nn.BatchNorm1d(100),
    nn.ReLU(),
    nn.Linear(100, 100),
    nn.BatchNorm1d(100),
    nn.ReLU(),
    nn.Linear(100, len_embedding),

)
class SELayer(nn.Module):
    def __init__(self, channel, reduction=16):
        super(SELayer, self).__init__()
        self.avg_pool = nn.AdaptiveAvgPool1d(1)
        self.fc = nn.Sequential(
            nn.Linear(channel, channel // reduction, bias=False),
            nn.LeakyReLU(inplace=False),
            nn.Linear(channel // reduction, channel, bias=False),
            nn.Sigmoid()
        )

    def forward(self, x):
        b, c, _ = x.size()
        #print('channel:',c)
        #print('size:',x.shape)
        y = self.avg_pool(x).view(b, c)
        y = self.fc(y).view(b, c, 1)
        #print('y_size:',y.shape)
        return x * y.expand_as(x)
class MutiheadAttention(nn.Module):
    def __init__(self, input_dim, dim_k, dim_v,num_heads):
        super(MutiheadAttention, self).__init__()
        self.dim_q = dim_k
        self.dim_k = dim_k
        self.dim_v = dim_v
        self.num_units=dim_k
        self.num_heads=num_heads
        self.linear_q = nn.Linear(input_dim, dim_k, bias=False)
        self.linear_k = nn.Linear(input_dim, dim_k, bias=False)
        self.linear_v = nn.Linear(input_dim, dim_v, bias=False)
        self._norm_fact = 1 / sqrt(dim_k)

    def forward(self, x):
        # x: batch_size, seq_len, input_dim
        q = self.linear_q(x)  # batch_size, seq_len, dim_k
        k = self.linear_k(x)  # batch_size, seq_len, dim_k
        v = self.linear_v(x)  # batch_size, seq_len, dim_v
        split_size = self.num_units // self.num_heads
        q = torch.stack(torch.split(q, split_size, dim=2), dim=0)  # [h, N, T_q, num_units/h]
        k = torch.stack(torch.split(k, split_size, dim=2), dim=0)  # [h, N, T_k, num_units/h]
        v = torch.stack(torch.split(v, split_size, dim=2), dim=0)  # [h, N, T_k, num_units/h]

        scores = torch.matmul(q, k.transpose(2, 3))
        scores = scores / (self.dim_k ** 0.5)

        scores = F.softmax(scores, dim=3)
        ## out = score * V
        out = torch.matmul(scores, v)  # [h, N, T_q, num_units/h]
        out = torch.cat(torch.split(out, 1, dim=0), dim=3).squeeze(0)

        return out

class ResidualBlock(torch.nn.Module):
    def __init__(self,channels):
        super(ResidualBlock,self).__init__()
        self.channels = channels
        self.conv1 = nn.Conv1d(channels,channels,kernel_size=3,padding=1)
        self.conv2 = nn.Conv1d(channels,channels,kernel_size=3,padding=1)
        self.se=SELayer(channels,16)
    def forward(self, x):
        y = F.relu(self.conv1(x))
        y = self.conv2(y)
        y=self.se(y)
        return F.relu(x+y)

class DestinyNet(nn.Module):
    def __init__(self):
        nn.Module.__init__(self)
        self.att=MutiheadAttention(len_embedding*2,512,512,64)
        self.layernorm=nn.LayerNorm(512)
        self.conv1 = nn.Conv1d(1, 32, 4)
        self.relu1=nn.LeakyReLU(0.2, inplace=True)
        self.rblock1 = ResidualBlock(32)
        self.conv2 = nn.Conv1d(32,64, 4)
        self.batchn1=nn.BatchNorm1d(64)
        self.relu2= nn.LeakyReLU(0.2, inplace=True)
        self.rblock2 = ResidualBlock(64)
        self.conv3=nn.Conv1d(64,128,4)
        self.batchn2=nn.BatchNorm1d(128)
        self.relu3= nn.LeakyReLU(0.2, inplace=True)
        self.rblock3 = ResidualBlock(128)
        self.conv4=nn.Conv1d(128,256,4)
        self.batchn3=nn.BatchNorm1d(256)
        self.relu4= nn.LeakyReLU(0.2, inplace=True)
        self.rblock4 = ResidualBlock(256)
        self.dropout=nn.Dropout()
        self.fc1 = nn.Linear(7424, num_relations)

    def forward(self, x):
        x=self.att(x)+x
        x=self.layernorm(x)
        x = self.conv1(x)
        x = self.relu1(x)
        x = F.max_pool1d(x, 2)
        x=self.rblock1(x)
        x = self.conv2(x)
        x=self.batchn1(x)
        x=self.relu2(x)
        x = F.max_pool1d(x, 2)
        x=self.rblock2(x)

        x = self.conv3(x)
        x=self.batchn2(x)
        x=self.relu3(x)
        x = F.max_pool1d(x, 2)
        x=self.rblock3(x)

        x = self.conv4(x)
        x=self.batchn3(x)
        x=self.relu4(x)
        x = F.max_pool1d(x, 2)
        x=self.rblock4(x)
        x = x.view(x.size()[0], -1)
        x=self.dropout(x)
        x=self.fc1(x)
        return x
class TrainDataset(Dataset):
    def __init__(self,length):
        self.length=length

    def __getitem__(self, idx):
        cell1_id=int(traincell1[idx])
        cell2_id=int(traincell2[idx])
        gene1=adata_orig.X[cell1_id]
        gene1=torch.tensor(gene1)
        gene2=adata_orig.X[cell2_id]
        gene2=torch.tensor(gene2)
        genetype=train_rel[idx]
        #genetype=dic1[genetype]
        genetype=torch.tensor(genetype)
        return gene1,gene2,genetype

    def __len__(self):
        return self.length
model=DestinyNet()
optimizer = torch.optim.Adam(
    [{'params': geneEnc.parameters()},
    {'params': model.parameters()},
        {'params': geneDec.parameters()},
    #{'params': norelmodel.parameters()},
            {'params': genemap.parameters()}],
    lr=learning_rate)
from sklearn.metrics import confusion_matrix
TwoNets_path='/home/zhengtuo/songtao/weinreb.pth'
checkpoint = torch.load(TwoNets_path,map_location='cuda:1')
device2=torch.device("cuda:1")
device=torch.device("cuda:1")

model.load_state_dict(checkpoint['model'])
model.to(device2)
geneEnc.load_state_dict(checkpoint['geneEnc'])
geneEnc.to(device2)
geneDec.load_state_dict(checkpoint['geneDec'])
geneDec.to(device2)

model.eval()
geneEnc.eval()
geneDec.eval()

genemap.load_state_dict(checkpoint['genemap'])
genemap.to(device2)
genemap.eval()
[15]:
Sequential(
  (0): Linear(in_features=256, out_features=100, bias=True)
  (1): BatchNorm1d(100, eps=1e-05, momentum=0.1, affine=True, track_running_stats=True)
  (2): ReLU()
  (3): Linear(in_features=100, out_features=100, bias=True)
  (4): BatchNorm1d(100, eps=1e-05, momentum=0.1, affine=True, track_running_stats=True)
  (5): ReLU()
  (6): Linear(in_features=100, out_features=100, bias=True)
  (7): BatchNorm1d(100, eps=1e-05, momentum=0.1, affine=True, track_running_stats=True)
  (8): ReLU()
  (9): Linear(in_features=100, out_features=100, bias=True)
  (10): BatchNorm1d(100, eps=1e-05, momentum=0.1, affine=True, track_running_stats=True)
  (11): ReLU()
  (12): Linear(in_features=100, out_features=256, bias=True)
)
[21]:
def compute_velocity_on_grid(
X_emb,
M_emb,
density=None,
smooth=None,
n_neighbors=None,
min_mass=None,
autoscale=True,
adjust_for_stream=False,
cutoff_perc=None,
):
# remove invalid cells
idx_valid = np.isfinite(X_emb.sum(1) + M_emb.sum(1))
X_emb = X_emb[idx_valid]
M_emb = M_emb[idx_valid]
# prepare grid
n_obs, n_dim = X_emb.shape
density = 0.5 if density is None else density
smooth = 0.5 if smooth is None else smooth
grs = []
for dim_i in range(n_dim):
m, M = np.min(X_emb[:, dim_i]), np.max(X_emb[:, dim_i])
m = m - 0.01 * np.abs(M - m)
M = M + 0.01 * np.abs(M - m)
gr = np.linspace(m, M, int(50 * density))
grs.append(gr)
meshes_tuple = np.meshgrid(*grs)
X_grid = np.vstack([i.flat for i in meshes_tuple]).T
# estimate grid velocities
if n_neighbors is None:
n_neighbors = int(n_obs / 50)
nn = NearestNeighbors(n_neighbors=n_neighbors, n_jobs=-1)
nn.fit(X_emb)
dists, neighs = nn.kneighbors(X_grid)
scale = np.mean([(g[1] - g[0]) for g in grs]) * smooth
weight = normal.pdf(x=dists, scale=scale)
p_mass = weight.sum(1)
V_grid = (M_emb[neighs] * weight[:, :, None]).sum(1)
V_grid /= np.maximum(1, p_mass)[:, None]
if min_mass is None:
min_mass = 1
if adjust_for_stream:
X_grid = np.stack([np.unique(X_grid[:, 0]), np.unique(X_grid[:, 1])])
ns = int(np.sqrt(len(V_grid[:, 0])))
V_grid = V_grid.T.reshape(2, ns, ns)
mass = np.sqrt((V_grid ** 2).sum(0))
min_mass = 10 ** (min_mass - 6) # default min_mass = 1e-5
min_mass = np.clip(min_mass, None, np.max(mass) * 0.9)
cutoff = mass.reshape(V_grid[0].shape) < min_mass
if cutoff_perc is None:
cutoff_perc = 5
length = np.sum(np.mean(np.abs(M_emb[neighs]), axis=1), axis=1).T
length = length.reshape(ns, ns)
cutoff |= length < np.percentile(length, cutoff_perc)
V_grid[0][cutoff] = np.nan
else:
min_mass *= np.percentile(p_mass, 99) / 100
X_grid, V_grid = X_grid[p_mass > min_mass], V_grid[p_mass > min_mass]
if autoscale:
V_grid /= 3 * quiver_autoscale(X_grid, V_grid)
return X_grid, V_grid
def quiver_autoscale(X_emb, V_emb):
import matplotlib.pyplot as pl
scale_factor = np.abs(X_emb).max() # just so that it handles very large values
fig, ax = pl.subplots()
Q = ax.quiver(
X_emb[:, 0] / scale_factor,
X_emb[:, 1] / scale_factor,
V_emb[:, 0],
V_emb[:, 1],
angles="xy",
scale_units="xy",
scale=None,
)
Q._init()
fig.clf()
pl.close(fig)
return Q.scale / scale_factor
import numpy as np
from scipy.stats import norm as normal
from sklearn.neighbors import NearestNeighbors
import tqdm
sc.pp.neighbors(adata)
X = adata.obsm['geneEnc'][:,0,:]
M = adata.obsm['genemap'][:,0,:]
N = adata.obsp['connectivities']
E = adata.obsm["X_umap"]
norm = lambda x: (x-min(x))/(max(x)-min(x))
nn = NearestNeighbors(n_neighbors=20)
nn.fit(X)
dE = []
for i in tqdm.trange(N.shape[0]):
D,I = nn.kneighbors( np.array([M[i]]) )
dE.append( (E[I][0] - E[i]).mean(0))
dE = np.vstack(dE)
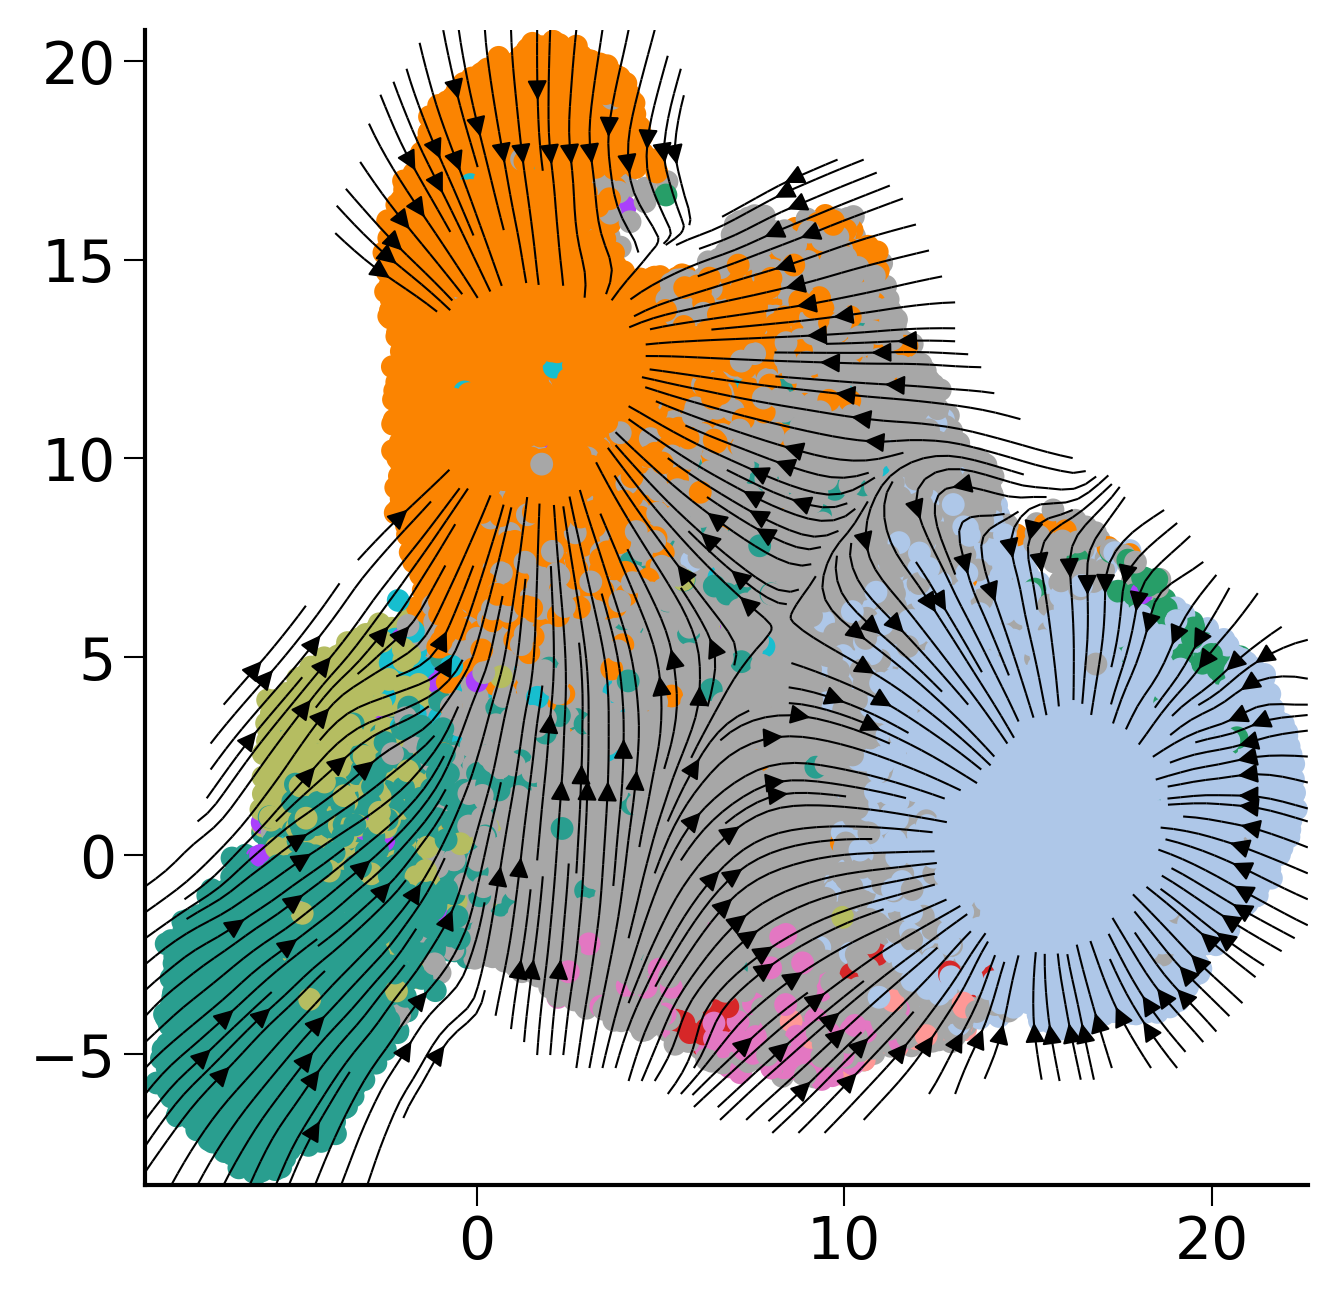
gE, gdE = compute_velocity_on_grid(E,dE,density=2, adjust_for_stream=True,smooth=True)
fig,ax=createFig()
fig.set_size_inches(5,5)
palette = sc.pl._tools.scatterplots._get_palette(adata, 'state_info')
ax.scatter(E[:,0],E[:,1],s=30, linewidths=0,c=list(map(lambda x: palette[x], adata.obs['state_info'])))
stream_kwargs = {
"linewidth": 0.5,
"density": 3,
"zorder": 3,
"color": "black",
"arrowsize": 1,
"arrowstyle": "-|>",
"maxlength": 10,
"integration_direction": "both",
}
ax.streamplot(gE[0],gE[1],gdE[0],gdE[1],**stream_kwargs)
100%|█████████████████████████████████████| 49116/49116 [28:23<00:00, 28.83it/s]
[21]:
<matplotlib.streamplot.StreamplotSet at 0x7f9138121c40>
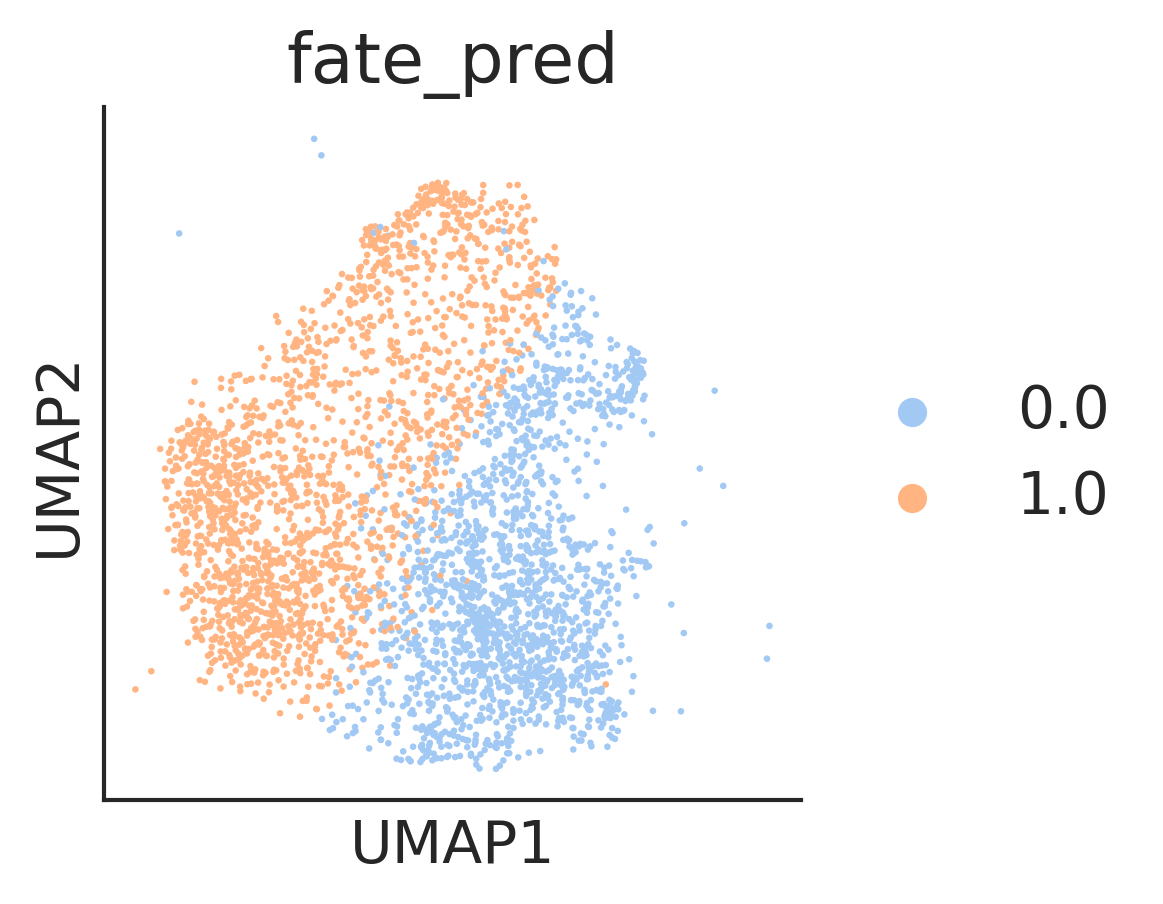
[93]:
adata3=adata[adata.obs['fate_pred'].isin([0,1])].copy()
adata3.obs['fate_pred'] = adata3.obs['fate_pred'].astype('category')

from sklearn.neighbors import KNeighborsClassifier
plt.rcParams['font.size'] = 14
fig,ax=createFig(figsize=(3,3))
sc.pl.umap(adata3,color=['fate_pred'],ax=ax,s=10)
sc.tl.rank_genes_groups(adata3, groupby='fate_pred', method='wilcoxon')
sc.pl.heatmap(
    adata3,
    pd.DataFrame(adata3.uns['rank_genes_groups']['names']).head(20).to_numpy().flatten(),
    groupby='fate_pred'#,log=True, cmap='Reds'
)
/home/zhengtuo/miniconda3/lib/python3.9/site-packages/scanpy/plotting/_tools/scatterplots.py:392: UserWarning: No data for colormapping provided via 'c'. Parameters 'cmap' will be ignored
  cax = scatter(

[95]:
#adata3.uns
pd.DataFrame(adata3.uns['rank_genes_groups']['logfoldchanges'].head(20),
             adata3.uns['rank_genes_groups']['names'].head(20))
[70]:
f_read = open('./dic_fate_weinreb_ourmodel_allundiff.pkl', 'rb')
#f_read = open('/home/zhengtuo/songtao/DestinyNet/weinreb_2.22_fate_and_prob/dic_fate_weinreb_ourmodel.pkl', 'rb')
a = pickle.load(f_read)
adata.obs['fate_pred']=None
adata.obs['fate_pred']=adata.obs['index'].map(a)
adata3=adata[adata.obs['fate_pred'].isin([0,1])].copy()
adata3.obs['fate_pred'] = adata3.obs['fate_pred'].astype('category')
sc.tl.rank_genes_groups(adata3, groupby='fate_pred', method='wilcoxon',use_raw=True)
# fig, ax = ScanpyVolcanoPlot(adata3, axis=1,
#                            label_fold_change=1,label_log_p=2,
#                            label_size=8,show_label=True,label_includes=['Elane'])
# ax.set_xbound(-5,5)
# fig.set_size_inches(5,5)
[129]:
adata3=adata[adata.obs['GT'].isin([0,1])].copy()
adata3.obs['GT']=adata3.obs['GT'].astype(str)
sc.tl.rank_genes_groups(adata3, groupby='GT', method='wilcoxon')
# fig, ax = ScanpyVolcanoPlot(adata3, axis=1,
#                            label_fold_change=1,label_log_p=2,
#                            label_size=8,show_label=True,label_includes=['Gata2'])
# ax.set_xbound(-5,5)
# fig.set_size_inches(5,5)
... storing 'GT' as categorical
[81]:
logFC_threshold = 1
adj_pval_threshold = 0.05
result_dict = adata3.uns['rank_genes_groups']
groups = result_dict['names'].dtype.names
markers_list = []
for group in groups:
    markers_df = pd.DataFrame(
        {
            'names': result_dict['names'][group],
            'scores': result_dict['scores'][group],
            'logfoldchanges': result_dict['logfoldchanges'][group],
            'pvals': result_dict['pvals'][group],
            'pvals_adj': result_dict['pvals_adj'][group],
            'group': group,
        }
    )
 # Filter the table by log fold change and adjusted p-value thresholds
    filtered_markers_df = markers_df[(markers_df['logfoldchanges'] > 1) & (markers_df['pvals_adj'] < adj_pval_threshold)]
    markers_list.append(filtered_markers_df)

all_markers_df = pd.concat(markers_list, axis=0)

all_markers_df.to_csv(f'/home/zhengtuo/songtao/marker_allundiff_pred_9.15.csv', index=False)
#all_markers_df.to_csv(f'/home/songtaojiang/deng/peaks_marker_withpeaks.csv', index=False)
[77]:
len(all_markers_df)
[77]:
264
[719]:
df_GT_pred=all_markers_df
df_GT_pred_group = df_GT_pred[df_GT_pred['group'] == '1.0']

genes_GT_pred = set(df_GT_pred_group['names'])
print(len(genes_GT_pred))
700
[95]:
import pandas as pd
from matplotlib_venn import venn3
import matplotlib.pyplot as plt
from matplotlib.backends.backend_pdf import PdfPages

df_GT_pred = pd.read_csv('/home/zhengtuo/songtao/marker_GT_pred.csv')
df_allundiff_pred = pd.read_csv('/home/zhengtuo/songtao/marker_allundiff_pred.csv')
df_GT_groundtruth = pd.read_csv('/home/zhengtuo/songtao/marker_GT_groundtruth.csv')

with PdfPages('./Venn3_weinreb.pdf') as pdf:
    for group in df_GT_pred['group'].unique():
        df_GT_pred_group = df_GT_pred[df_GT_pred['group'] == group]
        df_allundiff_pred_group = df_allundiff_pred[df_allundiff_pred['group'] == group]
        df_GT_groundtruth_group = df_GT_groundtruth[df_GT_groundtruth['group'] == group]

        genes_GT_pred = set(df_GT_pred_group['names'])
        genes_allundiff_pred = set(df_allundiff_pred_group['names'])
        genes_GT_groundtruth = set(df_GT_groundtruth_group['names'])
        print(len(genes_GT_pred))
        print(len(genes_allundiff_pred))
        print(len(genes_GT_groundtruth))
        overlap_GT_pred_allundiff = genes_GT_pred.intersection(genes_allundiff_pred)
        overlap_GT_pred_groundtruth = genes_GT_pred.intersection(genes_GT_groundtruth)
        overlap_allundiff_groundtruth = genes_allundiff_pred.intersection(genes_GT_groundtruth)

        fig, ax = plt.subplots()
        venn3([genes_GT_pred, genes_allundiff_pred, genes_GT_groundtruth], ('GT_pred', 'allundiff_pred', 'GT_groundtruth'), ax=ax)
        ax.set_title(f'Overlap among GT_pred, allundiff_pred and GT_groundtruth for group {group}')

        pdf.savefig(fig, bbox_inches='tight')
        plt.close(fig)
78
109
75
85
90
70
[680]:
df_GT_pred[df_GT_pred['group'] == 0.0]
[680]:
| names | scores | logfoldchanges | pvals | pvals_adj | group | |
|---|---|---|---|---|---|---|
| 0 | Fth1 | 20.916939 | 0.655497 | 3.754473e-97 | 1.898938e-93 | 0.0 |
| 1 | Cybb | 16.727560 | 2.075559 | 8.255037e-63 | 2.087616e-59 | 0.0 |
| 2 | Ifi203 | 16.475517 | 1.720728 | 5.501524e-61 | 1.264800e-57 | 0.0 |
| 3 | Ly6a | 16.257133 | 1.924848 | 1.988261e-59 | 3.867780e-56 | 0.0 |
| 4 | Psap | 15.400703 | 1.177309 | 1.618987e-53 | 2.732804e-50 | 0.0 |
| ... | ... | ... | ... | ... | ... | ... |
| 241 | Ywhab | 3.156941 | 0.169605 | 1.594336e-03 | 4.354121e-02 | 0.0 |
| 242 | Cse1l | 3.155207 | 0.204191 | 1.603845e-03 | 4.370650e-02 | 0.0 |
| 243 | 1110004F10Rik | 3.151378 | 0.190176 | 1.625019e-03 | 4.423584e-02 | 0.0 |
| 244 | Anxa2 | 3.141347 | 0.340332 | 1.681729e-03 | 4.558332e-02 | 0.0 |
| 245 | Fmnl1 | 3.136003 | 0.810482 | 1.712677e-03 | 4.637247e-02 | 0.0 |
246 rows × 6 columns
[126]:
f_read = open('/home/zhengtuo/songtao/DestinyNet/weinreb_2.22_fate_and_prob/dic_fate_weinreb_ourmodel.pkl', 'rb')
a = pickle.load(f_read)
adata.obs['fate_pred']=None
adata.obs['fate_pred']=adata.obs['index'].map(a)
adata3=adata[adata.obs['fate_pred'].isin([0,1])].copy()
adata3.obs['fate_pred'] = adata3.obs['fate_pred'].astype('category')
sc.tl.rank_genes_groups(adata3, groupby='fate_pred', method='wilcoxon')

# fig, ax = ScanpyVolcanoPlot(adata3, axis=1,
#                            label_fold_change=1,label_log_p=2,
#                            label_size=8,show_label=True,label_includes=['Gata2'])
# ax.set_xbound(-5,5)
# fig.set_size_inches(5,5)
[122]:
weinreb_adata_background = adata[
    list(map(lambda x: x == 'Monocyte' or x == 'Neutrophil', adata.obs['state_info'] ))
]
sc.tl.rank_genes_groups(weinreb_adata_background, groupby='state_info',method='wilcoxon')
#ScanpyVolcanoPlot(weinreb_adata_background, axis=1)
[595]:
d = set(pd.DataFrame(adata3.uns['rank_genes_groups']['names'])['0.0'].loc[
    np.array(pd.DataFrame(adata3.uns['rank_genes_groups']['logfoldchanges'])['0.0'] > 1.5) &
    np.array(pd.DataFrame(adata3.uns['rank_genes_groups']['pvals_adj']['0.0']) < 0.05)
]).union(
set(pd.DataFrame(adata3.uns['rank_genes_groups']['names'])['1.0'].loc[
    np.array(pd.DataFrame(adata3.uns['rank_genes_groups']['logfoldchanges'])['1.0'] > 1.5) &
    np.array(pd.DataFrame(adata3.uns['rank_genes_groups']['pvals_adj']['1.0']) < 0.05)
]))
[194]:
s = set(pd.DataFrame(weinreb_adata_background.uns['rank_genes_groups']['names']).head(200).to_numpy().flatten())
[135]:
adata3.uns['rank_genes_groups']['pvals_adj']['1.0'][0]=1e-300
[135]:
1e-300
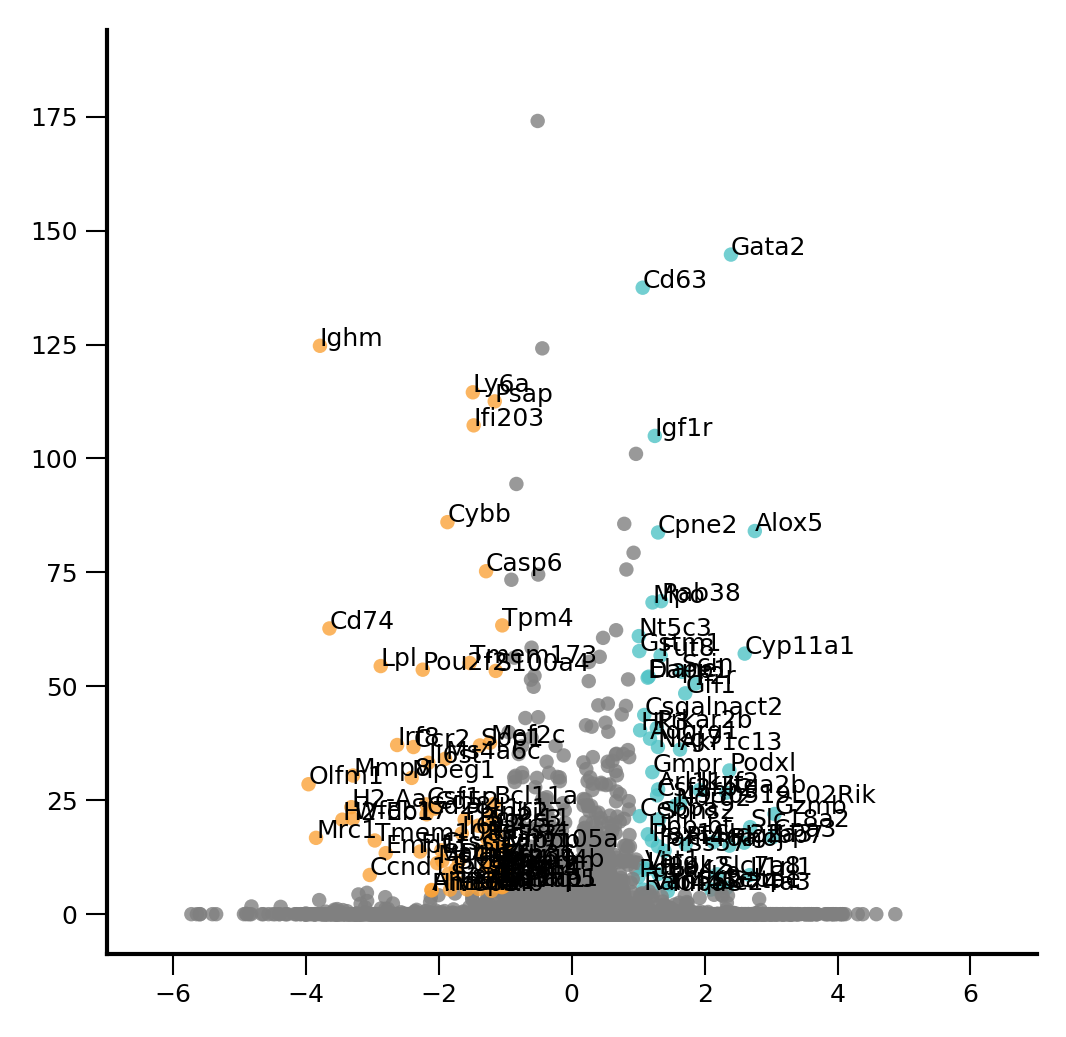
[18]:
plt.rcParams['font.size'] = 6

fig, ax = ScanpyVolcanoPlot(
    adata3,
    1,
    label_log_p=5,
    show_label=True,
    label_fold_change=1,
    label_size=6,
    add_grid=False,
    color1= '#50C3C6',
    color2= '#FAA339',
)

scatter = ax.collections[0]

y_values = scatter.get_offsets()[:, 1].compressed()

ymax = max(y_values) + 20

ax.set_xbound(-7,7)
ax.set_ybound(upper=ymax)
fig.set_size_inches(4,4)
ax.xaxis.set_ticks_position('bottom')
ax.yaxis.set_ticks_position('left')
plt.show()
#fig.savefig("/home/zhengtuo/songtao/weinreb_allundiff_pred_includeNeuMoMarker_nowords.pdf", dpi=1000)
/tmp/ipykernel_116596/210889169.py:5: RuntimeWarning: divide by zero encountered in log10
  log10adjp = -np.log10(list(map(lambda x: x[axis], adata.uns['rank_genes_groups']['pvals_adj'])))
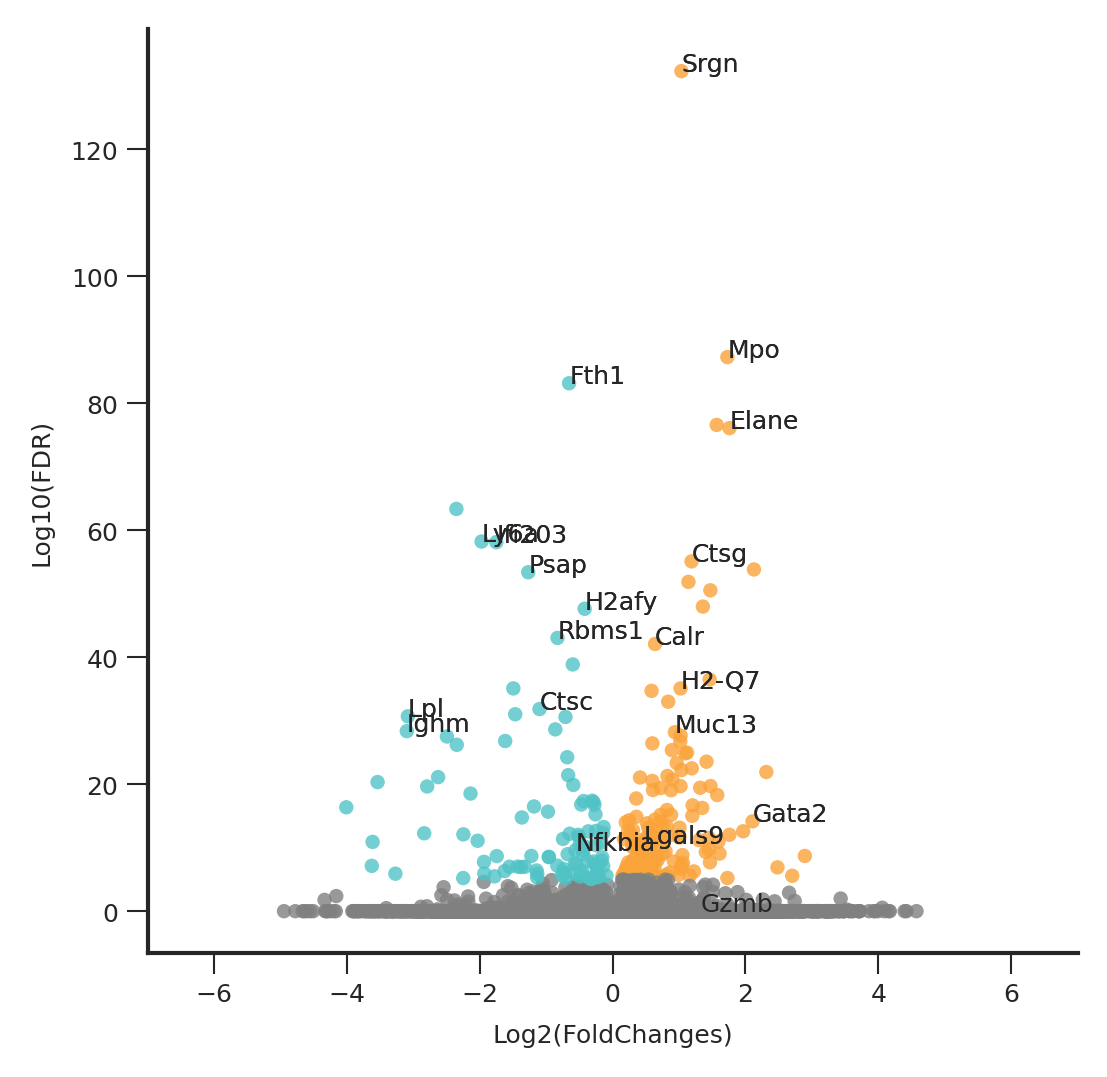
[577]:
top_genes
[577]:
Index(['Ctsc', 'Lpl', 'Nfkbia', 'Rbms1', 'Fth1', 'Psap', 'Ifi203', 'H2afy',
       'Ighm', 'Ly6a', 'Srgn', 'Gata2', 'Elane', 'Mpo', 'Lgals9', 'Muc13',
       'Gzmb', 'Ctsg', 'Calr', 'H2-Q7'],
      dtype='object')
[74]:
plt.rcParams['font.size'] = 6

fig, ax = ScanpyVolcanoPlot(
    adata3,
    1,
    label_log_p=5,
    show_label=True,
    label_fold_change=0,
    label_size=6,
    label_includes=top_genes,
    add_grid=False,
    color1= '#50C3C6',
    color2= '#FAA339',
)

ax.set_xbound(-7,7)
fig.set_size_inches(4,4)
ax.xaxis.set_ticks_position('bottom')
ax.yaxis.set_ticks_position('left')

to_remove_coords = []
for text in ax.texts:
    if text.get_text() not in list(top_genes):
        x, y = text.get_position()
        to_remove_coords.append((x, y))
        text.remove()

scatter = ax.collections[0]

offsets = scatter.get_offsets()
colors = scatter.get_facecolor()

new_colors = []
new_offsets = []

for i, offset in enumerate(offsets):
    if tuple(offset) not in to_remove_coords:
        new_offsets.append(offset)
        new_colors.append(colors[i])

assert len(new_colors) == len(new_offsets)

scatter.remove()

point_size = 10
ax.scatter(*zip(*new_offsets), c=new_colors, cmap=scatter.get_cmap(), norm=scatter.norm, s=point_size)

# 调整文字的大小
for text in ax.texts:
    text.set_fontsize(5)

# 扩大图形大小
fig.set_size_inches(4,4)

plt.draw()

fig.savefig("/home/zhengtuo/songtao/weinreb_GT_includeNeuMoMarker_top20withoutOthers.pdf", dpi=1000)
[599]:
plt.rcParams['font.size'] = 6

fig, ax = ScanpyVolcanoPlot(
    adata3,
    1,
    label_log_p=5,
    show_label=True,
    label_fold_change=0,
    label_size=6,
    label_includes=top_genes,
    add_grid=False,
    color1= '#50C3C6',
    color2= '#FAA339',
)

ax.set_xbound(-7,7)
fig.set_size_inches(4,4)
ax.xaxis.set_ticks_position('bottom')
ax.yaxis.set_ticks_position('left')

to_remove_coords = []
for text in ax.texts:
    if text.get_text() not in list(top_genes):
        x, y = text.get_position()
        to_remove_coords.append((x, y))
        text.remove()
plt.draw()

fig.savefig("/home/zhengtuo/songtao/weinreb_GT_includeNeuMoMarker_top20withOthers.pdf", dpi=1000)
[ ]:
[874]:
import matplotlib.pyplot as plt
from matplotlib.backends.backend_pdf import PdfPages
gene_jia=['Pou2f2', 'Tmem173', 'Rab38', 'Mef2c', 'Mmp8', 'S100a9', 'Ngp']
def create_umap_for_gene(adata, gene_name):
    fig, ax = plt.subplots()
    fig.set_size_inches(5, 5)
    ax.scatter(
        adata.obsm["X_umap"][:, 0],
        adata.obsm["X_umap"][:, 1],
        s=1,
        linewidths=0,
        color='#FDF6F3'
    )
    sc.pl.umap(
        adata[adata.X[:, list(adata.var.index).index(gene_name)] > 0], ax=ax,
        color=gene_name,
        cmap='Reds',
        s=5
    )
    return fig

with PdfPages('genes_extent.pdf') as pdf:
    for gene_name in gene_jia:
        fig = create_umap_for_gene(adata, gene_name)
        pdf.savefig(fig)
        plt.close(fig)
[610]:
import matplotlib.pyplot as plt
from matplotlib.backends.backend_pdf import PdfPages

def create_umap_for_gene(adata, gene_name):
    fig, ax = plt.subplots()
    fig.set_size_inches(5, 5)
    ax.scatter(
        adata.obsm["X_umap"][:, 0],
        adata.obsm["X_umap"][:, 1],
        s=1,
        linewidths=0,
        color='#FDF6F3'
    )
    sc.pl.umap(
        adata[adata.X[:, list(adata.var.index).index(gene_name)] > 0], ax=ax,
        color=gene_name,
        cmap='Reds',
        s=5
    )
    return fig

with PdfPages('top20genes_plots.pdf') as pdf:
    for gene_name in top_genes:
        fig = create_umap_for_gene(adata, gene_name)
        pdf.savefig(fig)
        plt.close(fig)
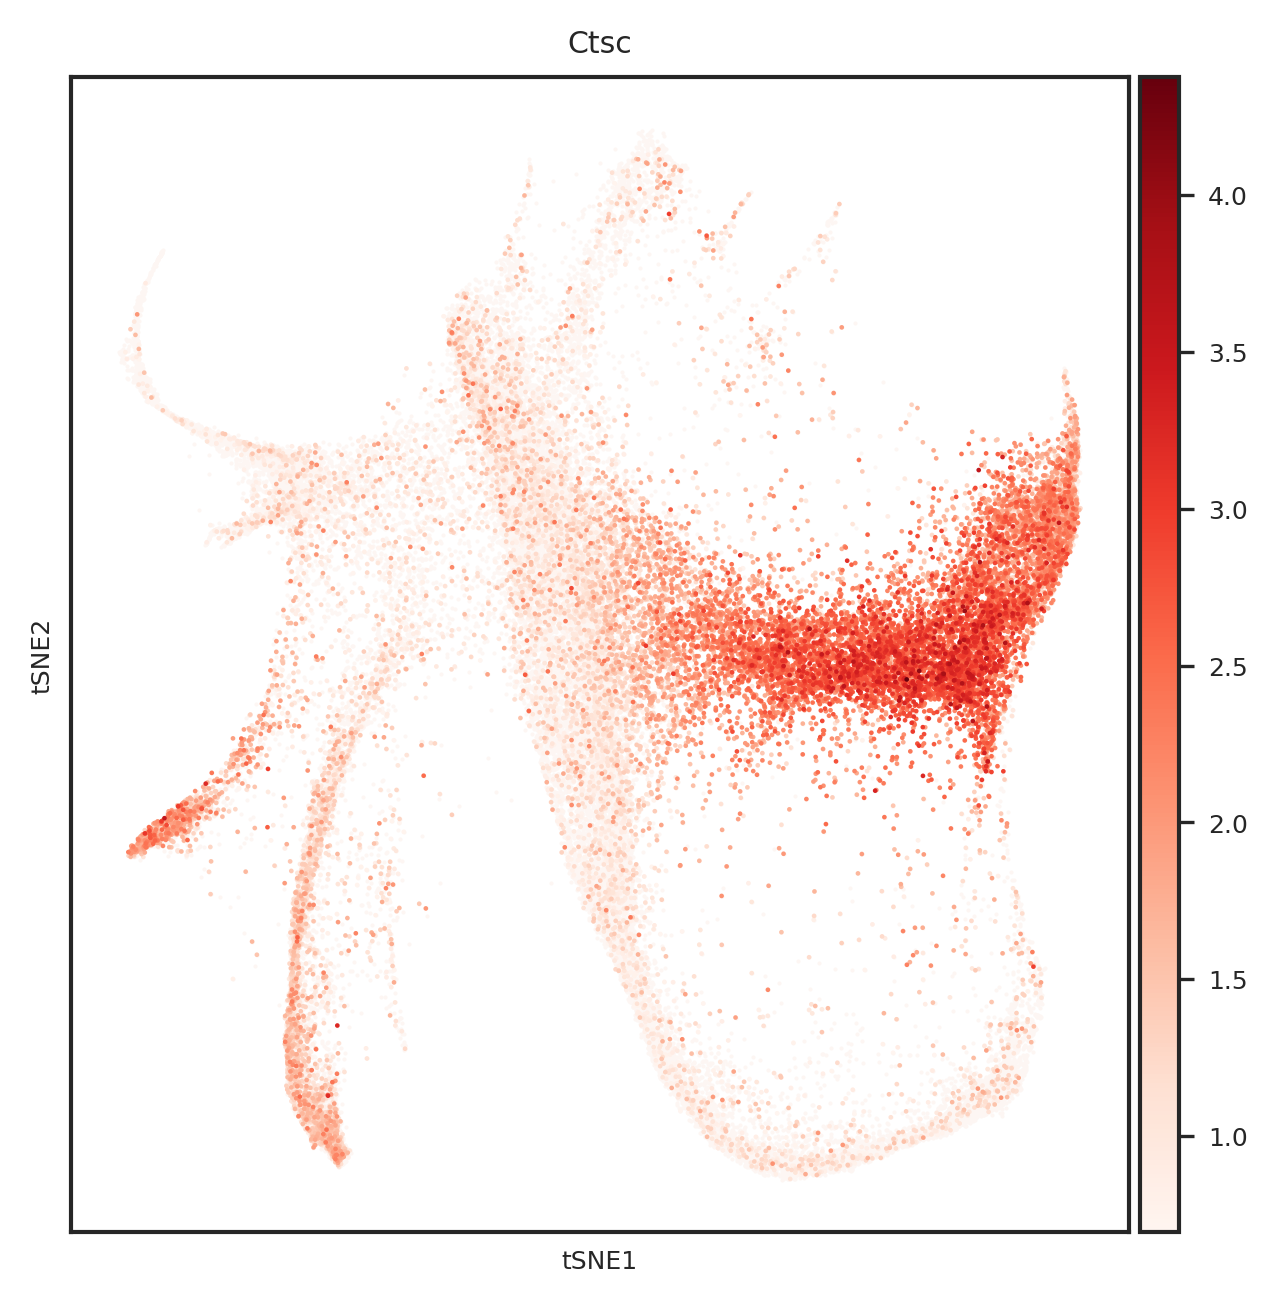
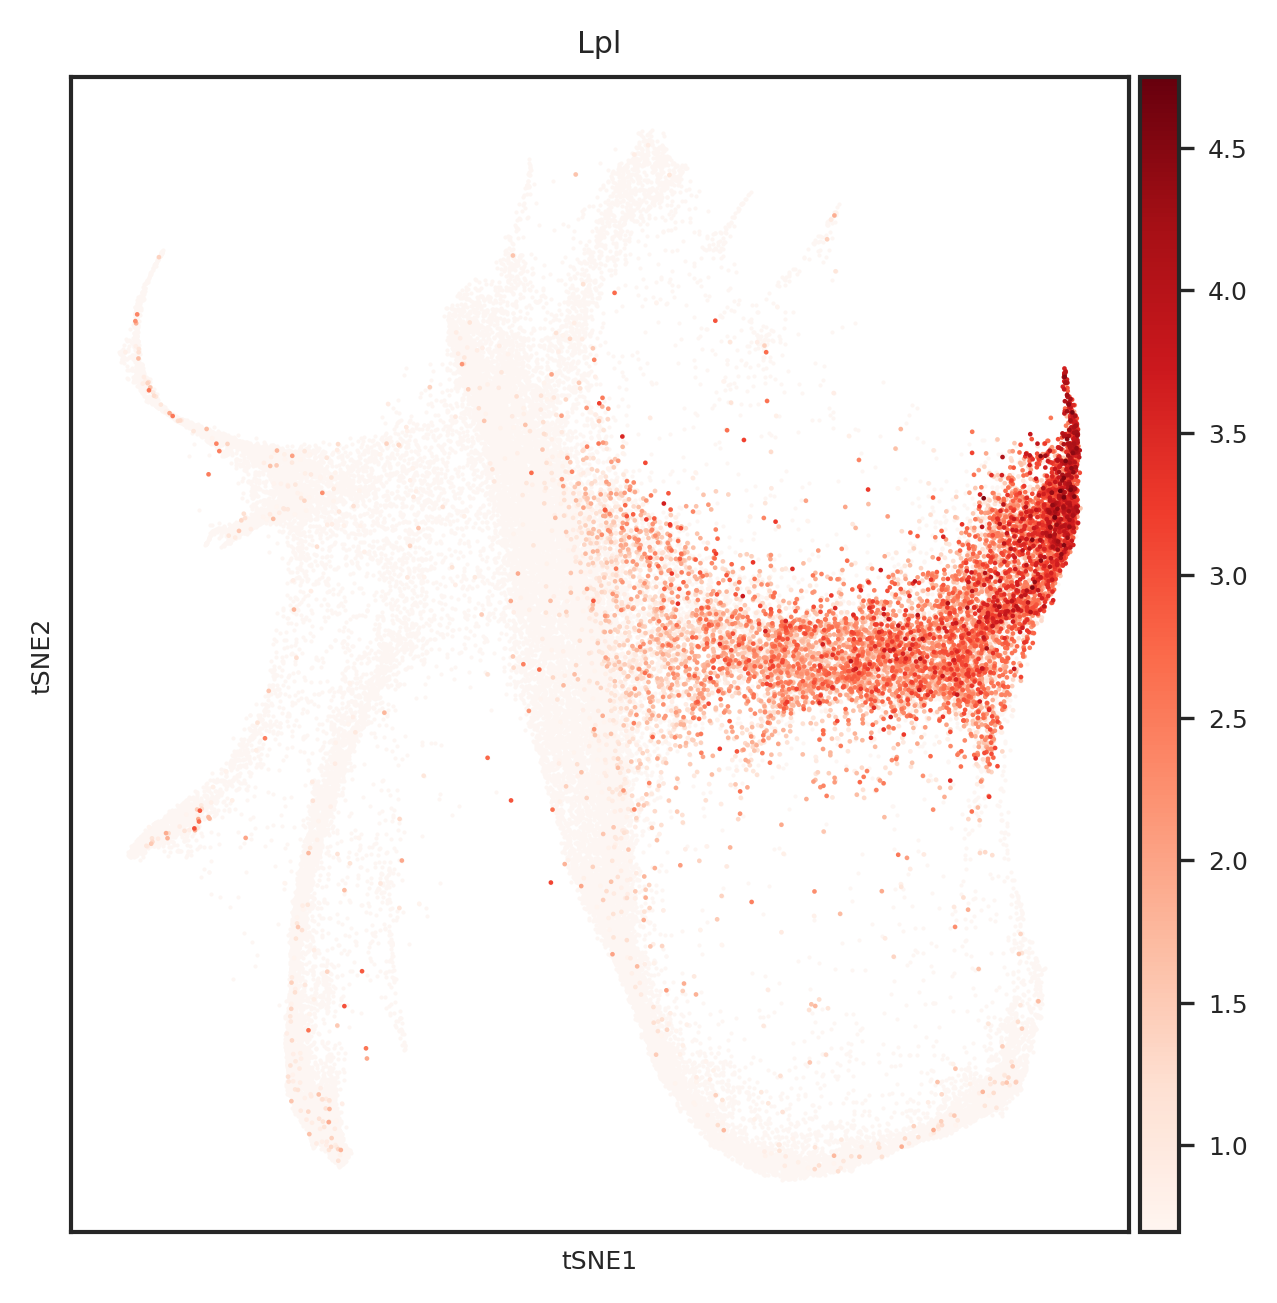
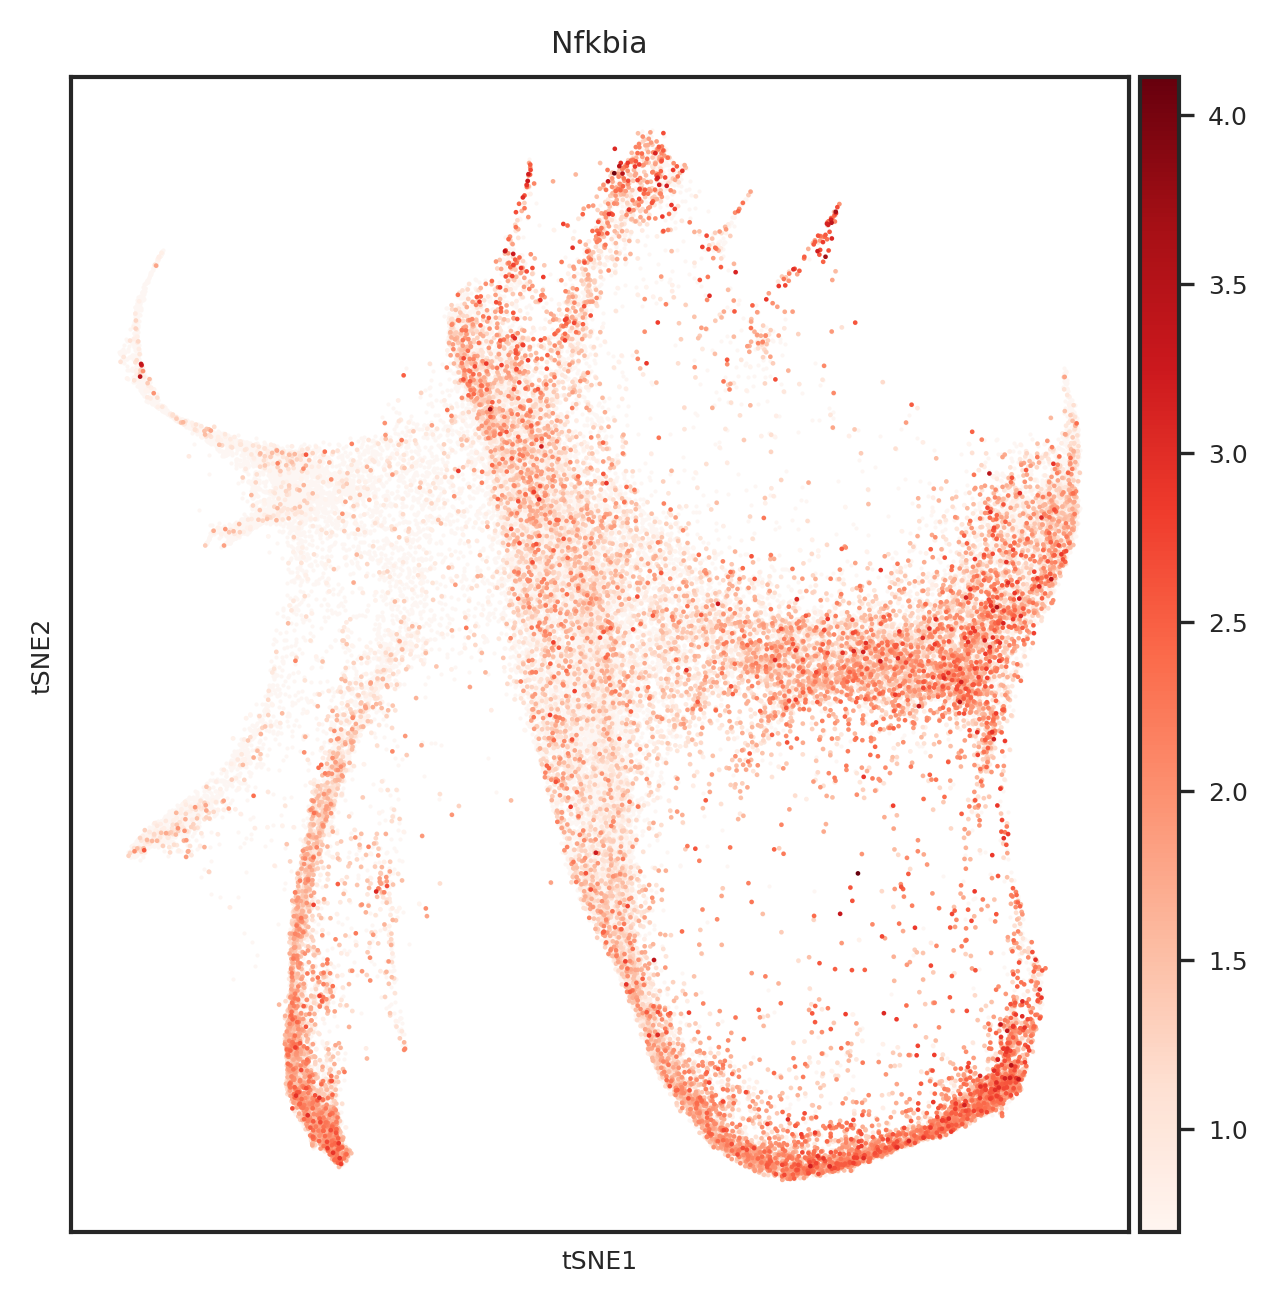
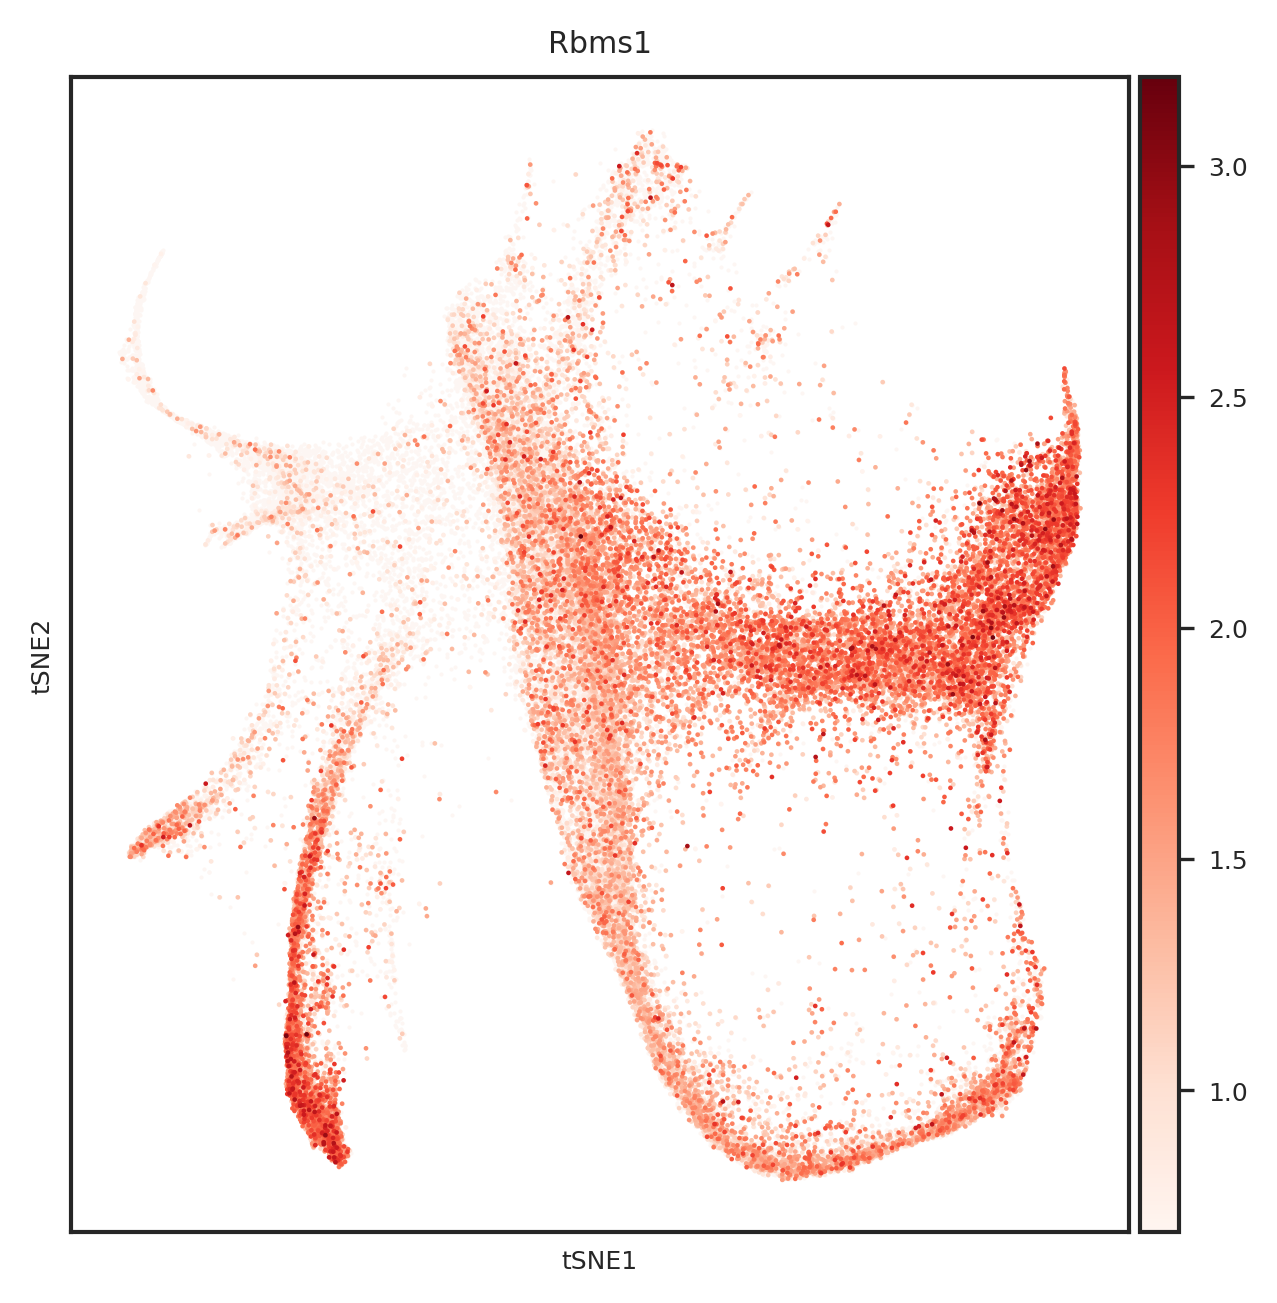
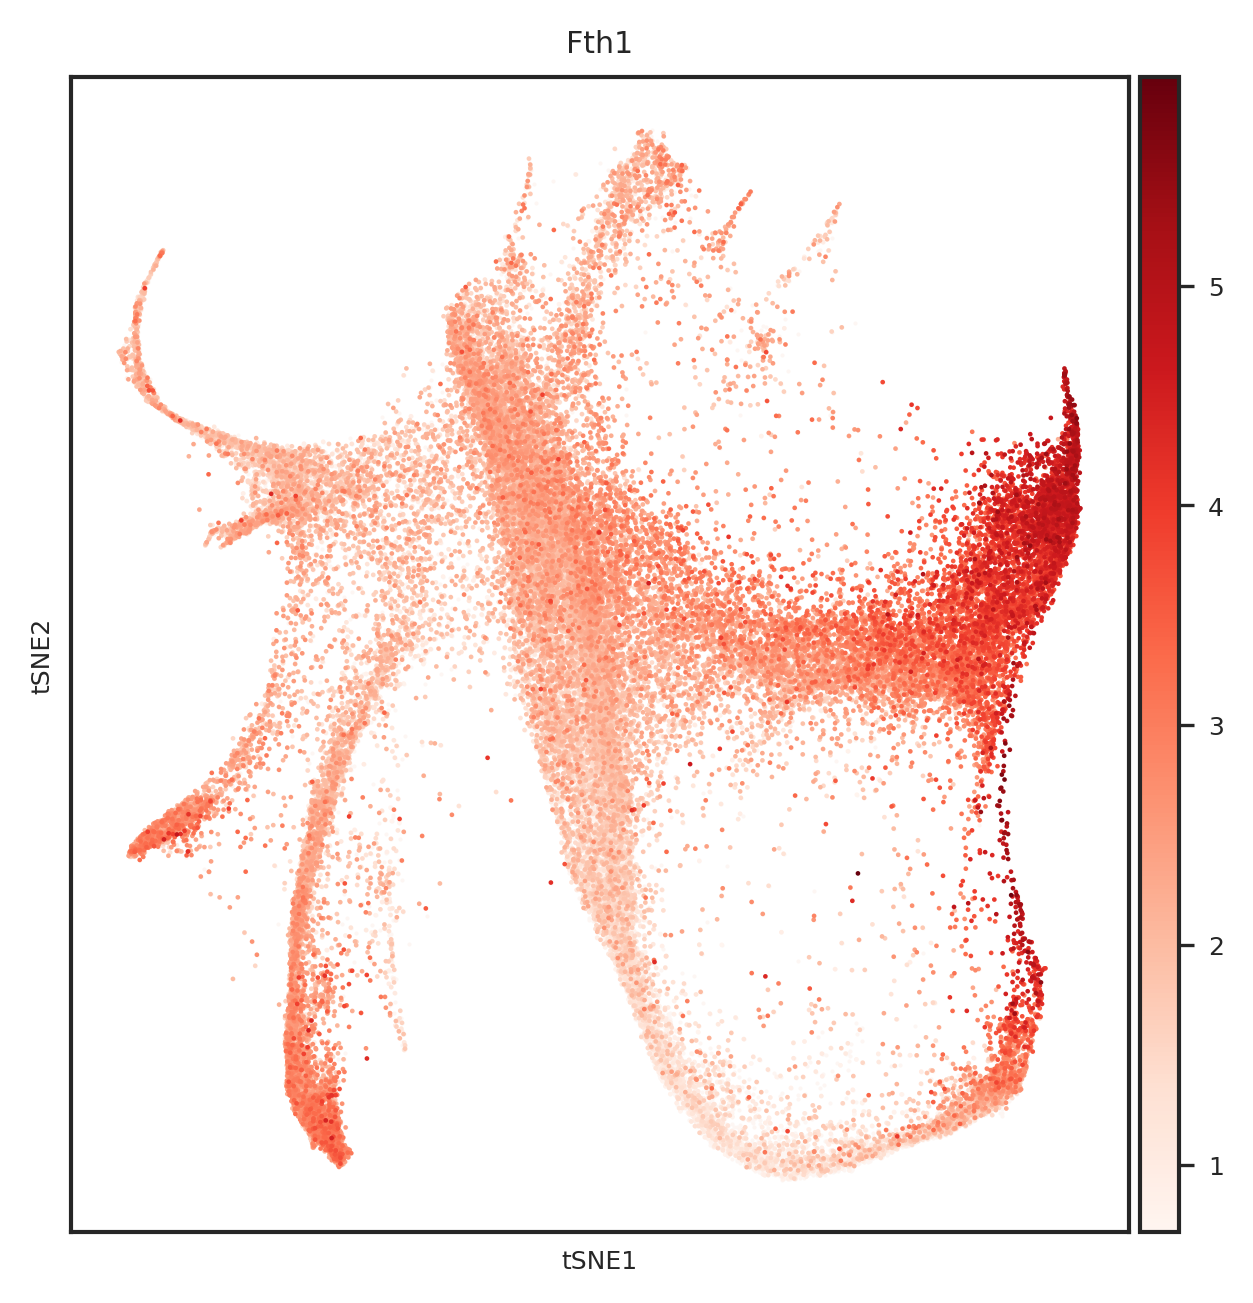
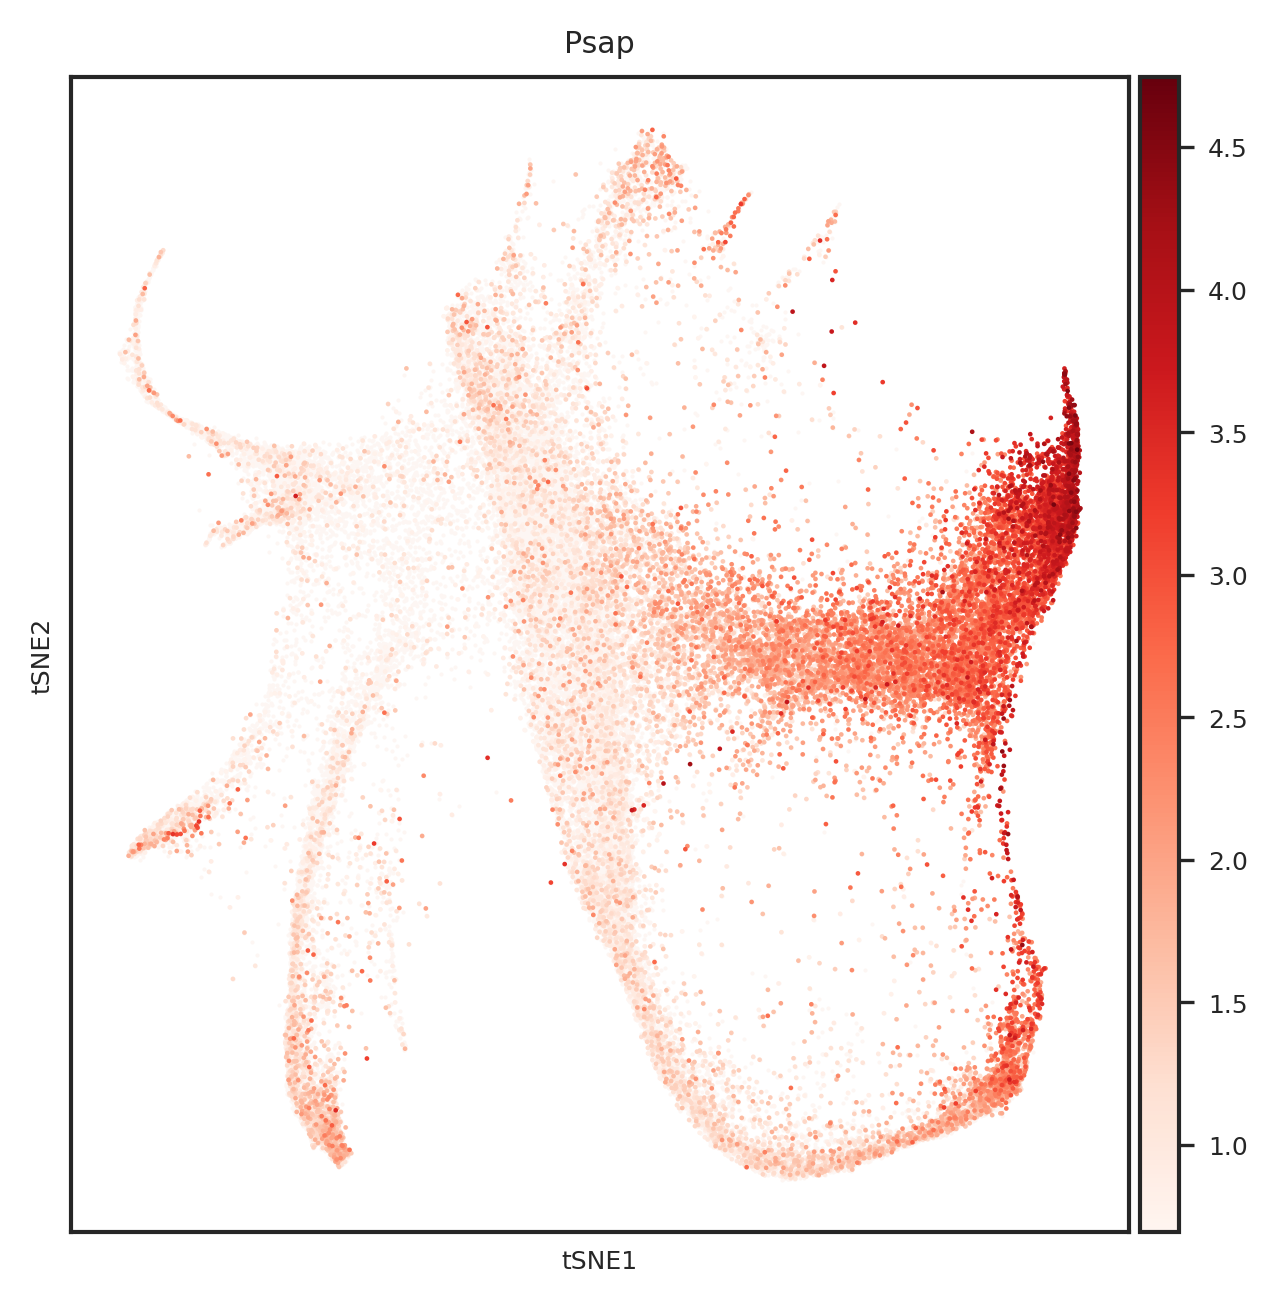
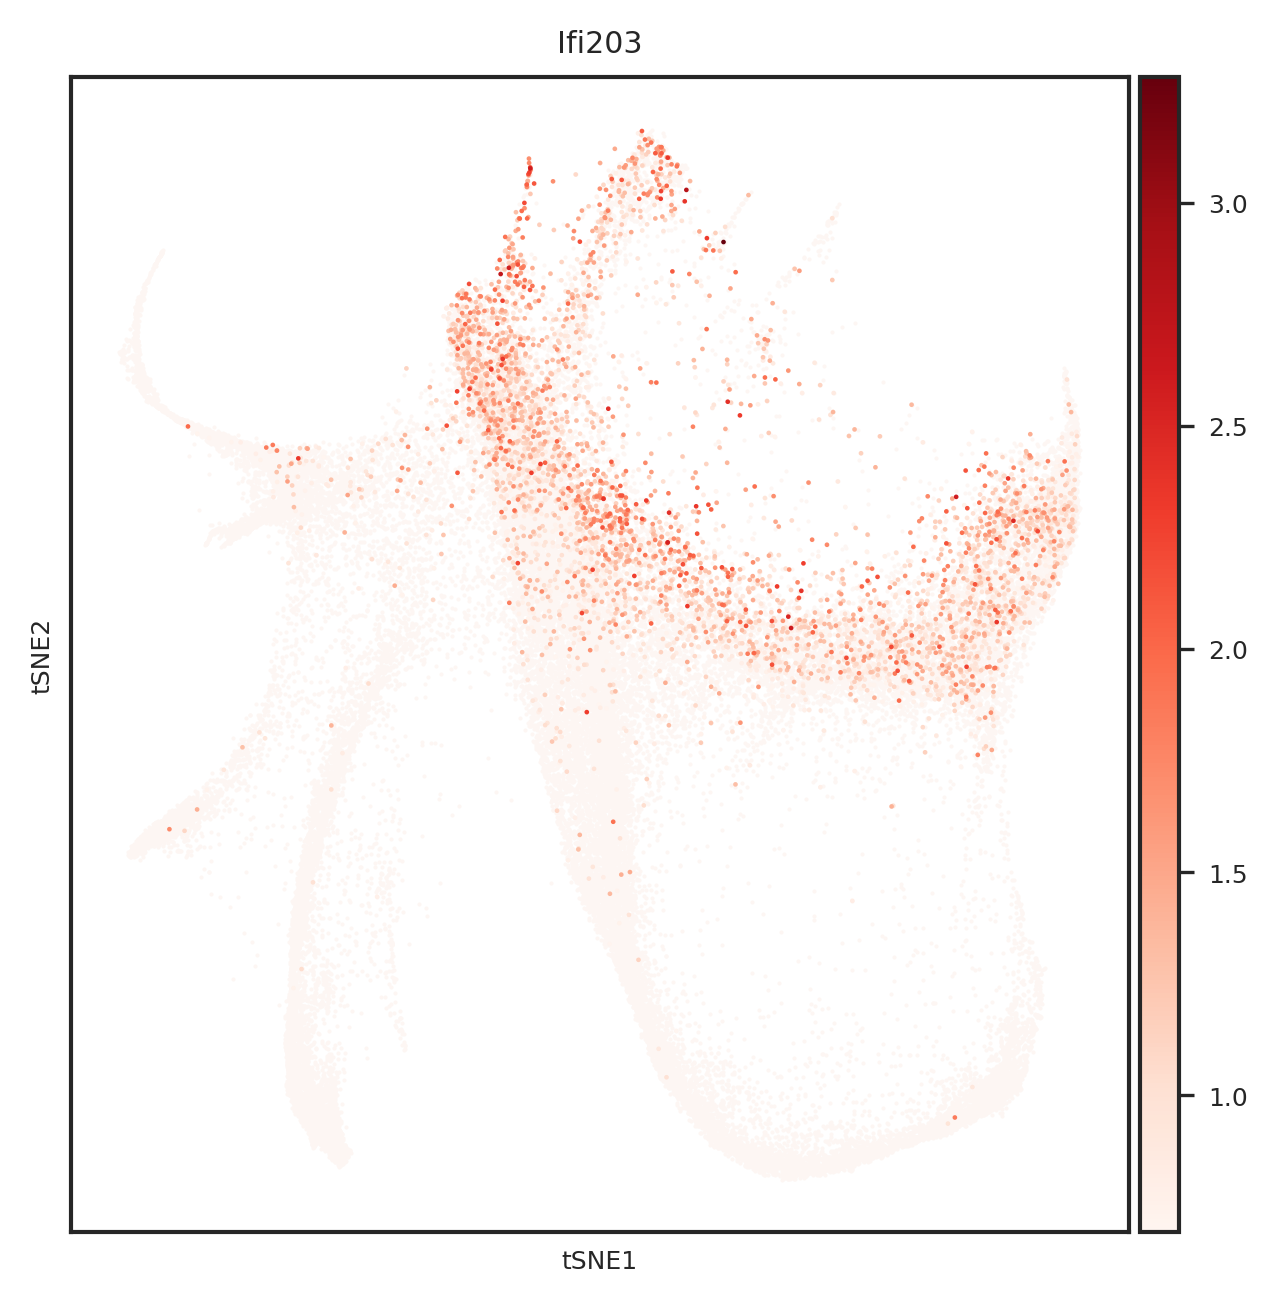
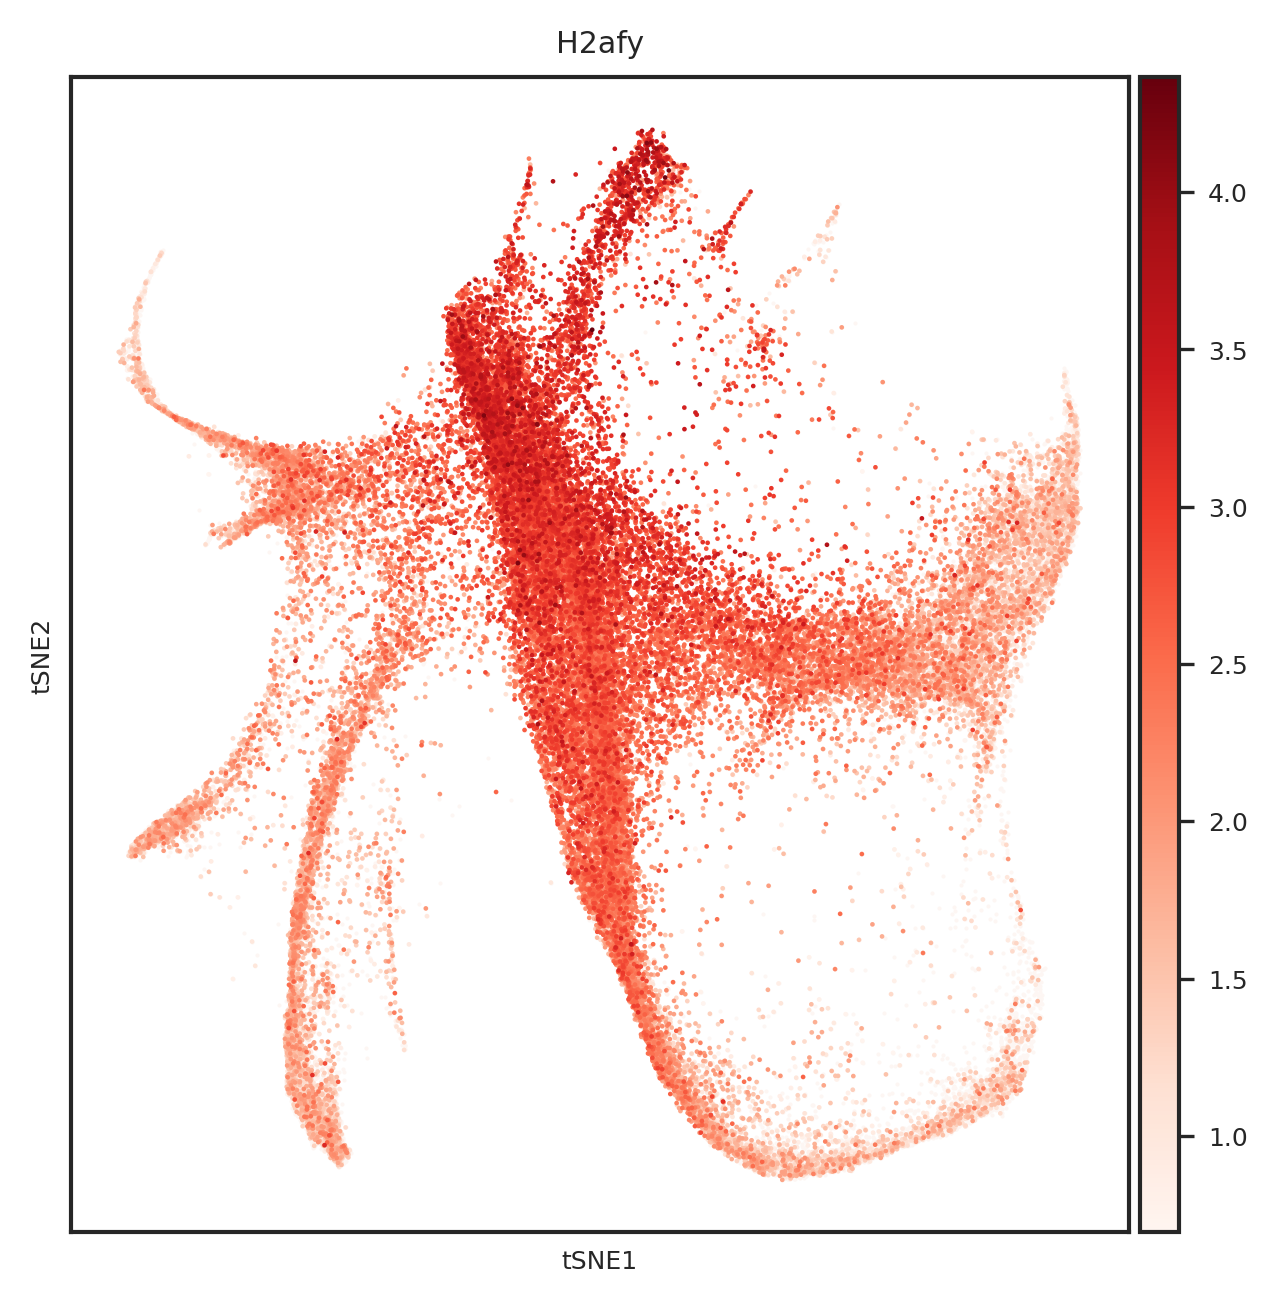
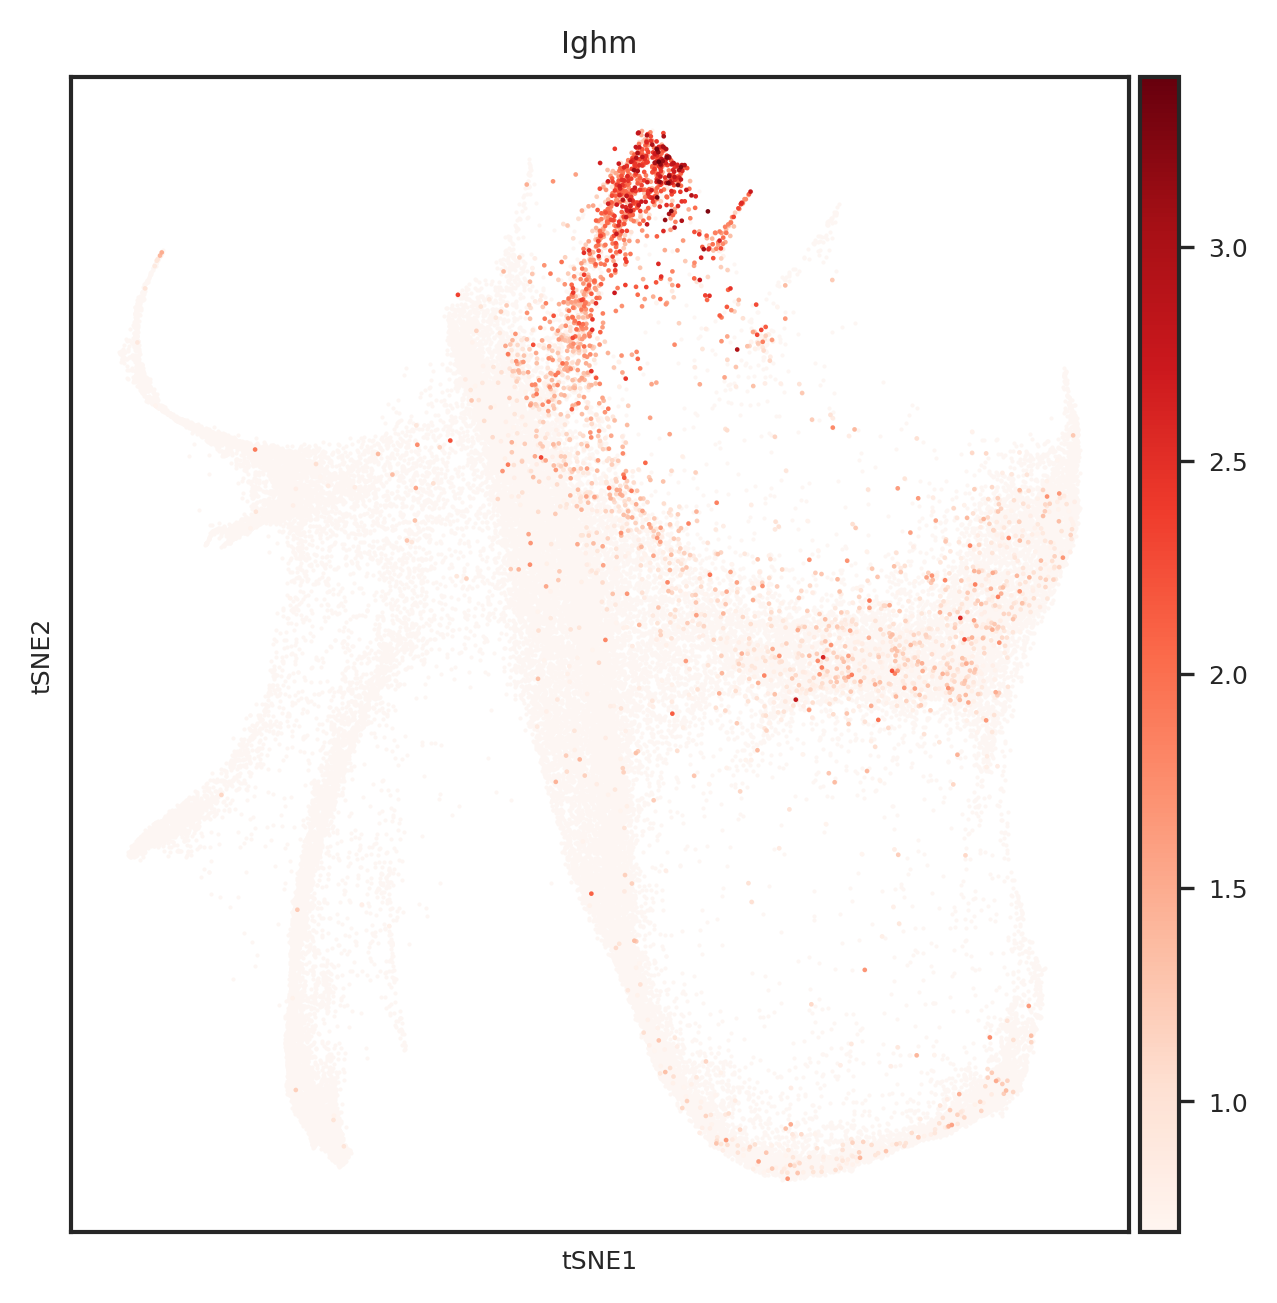
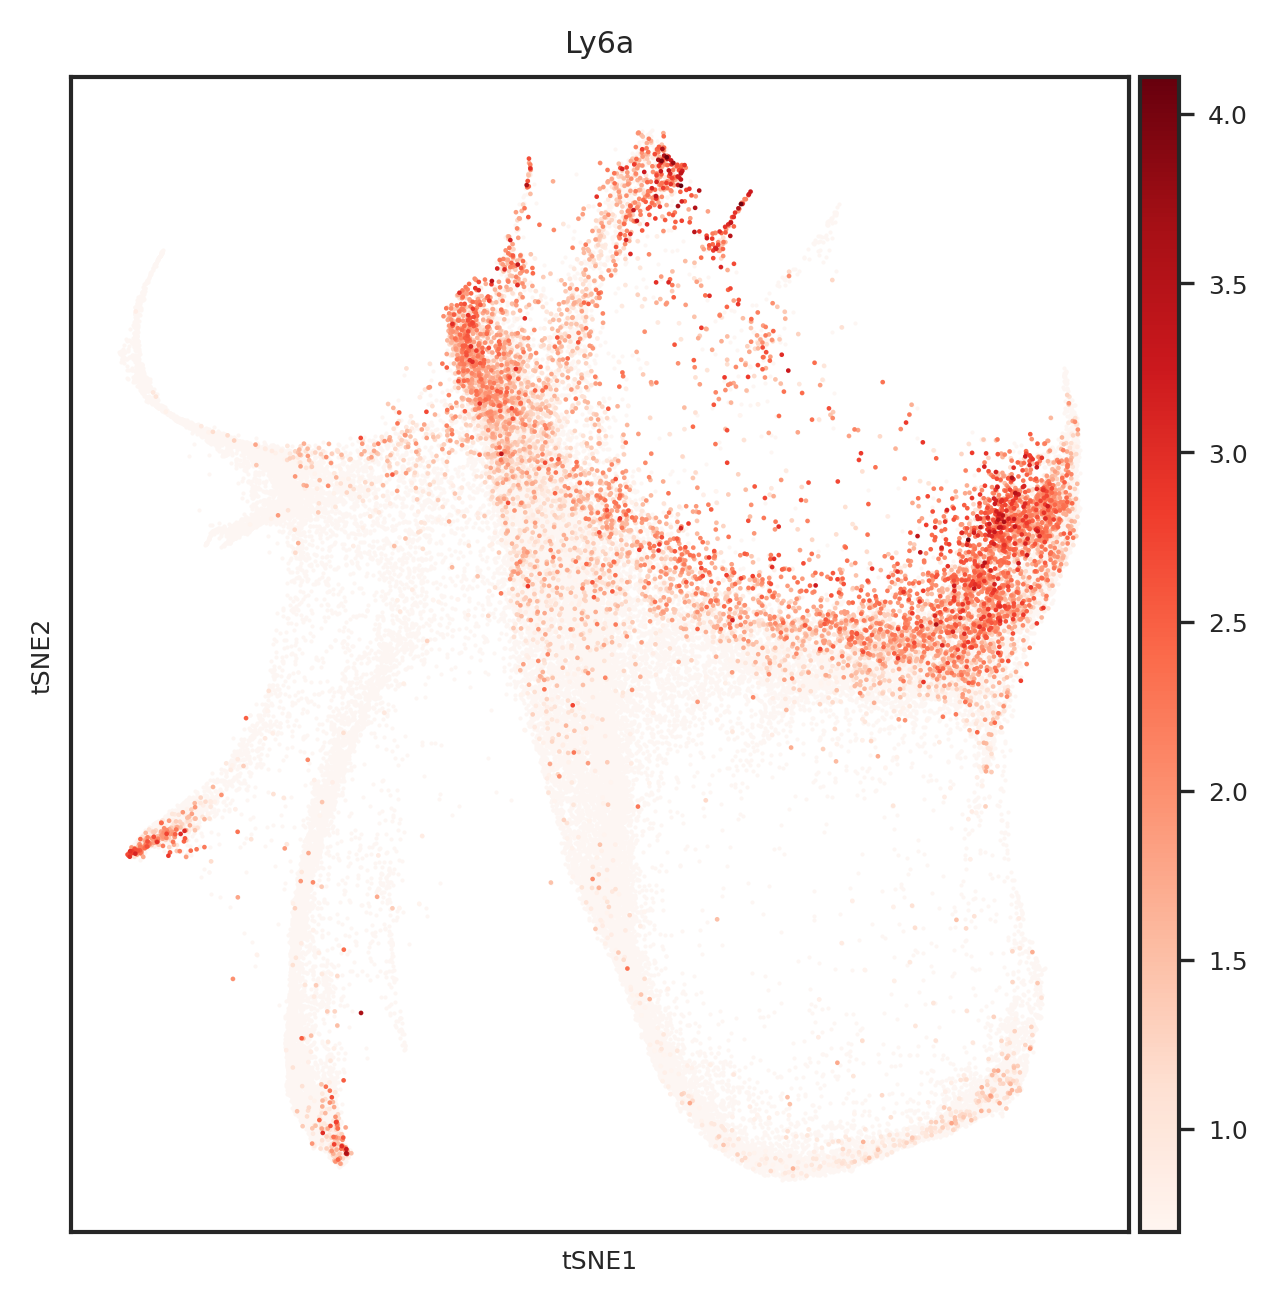
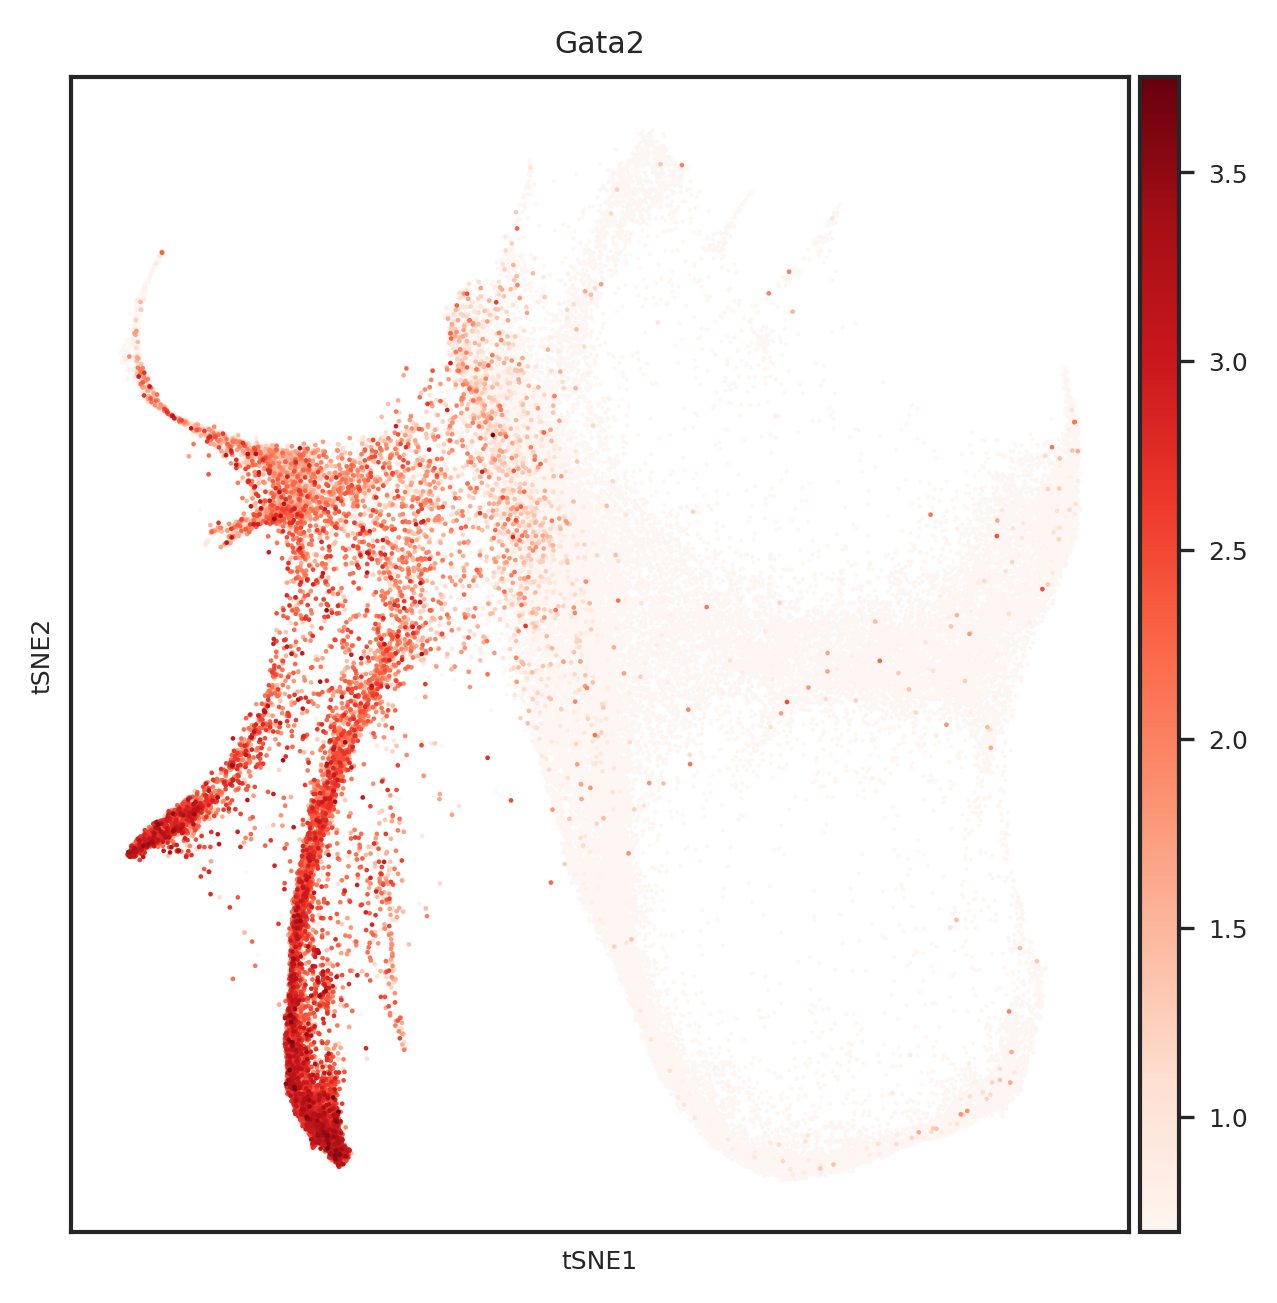
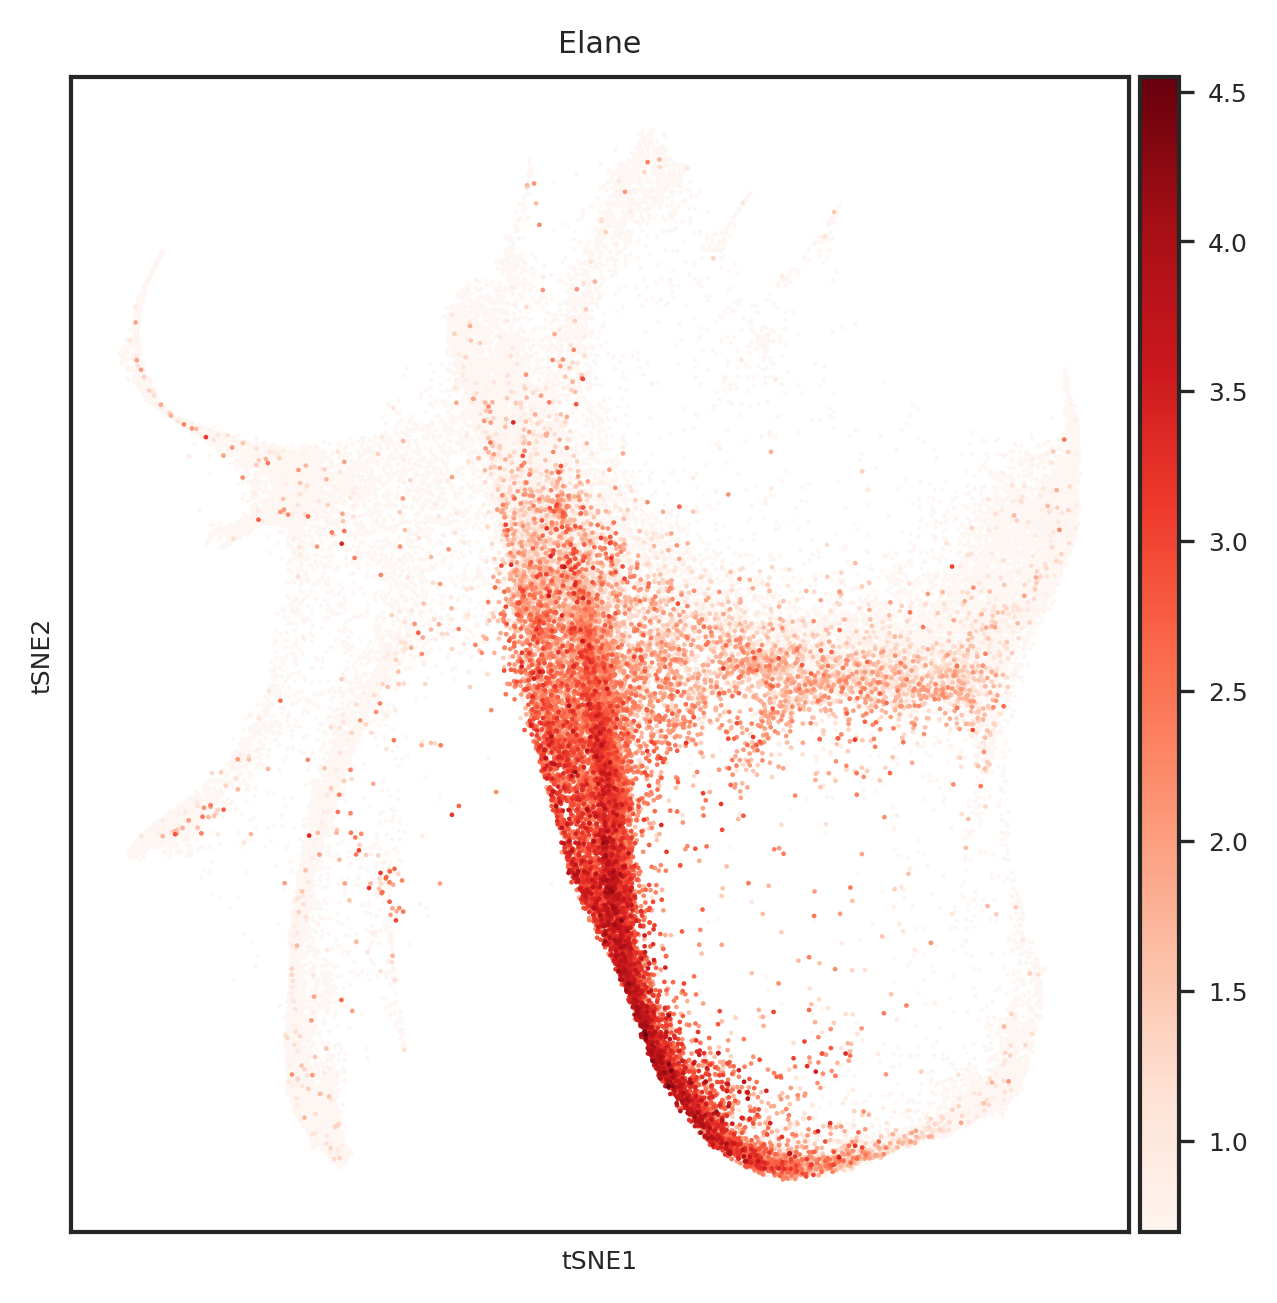
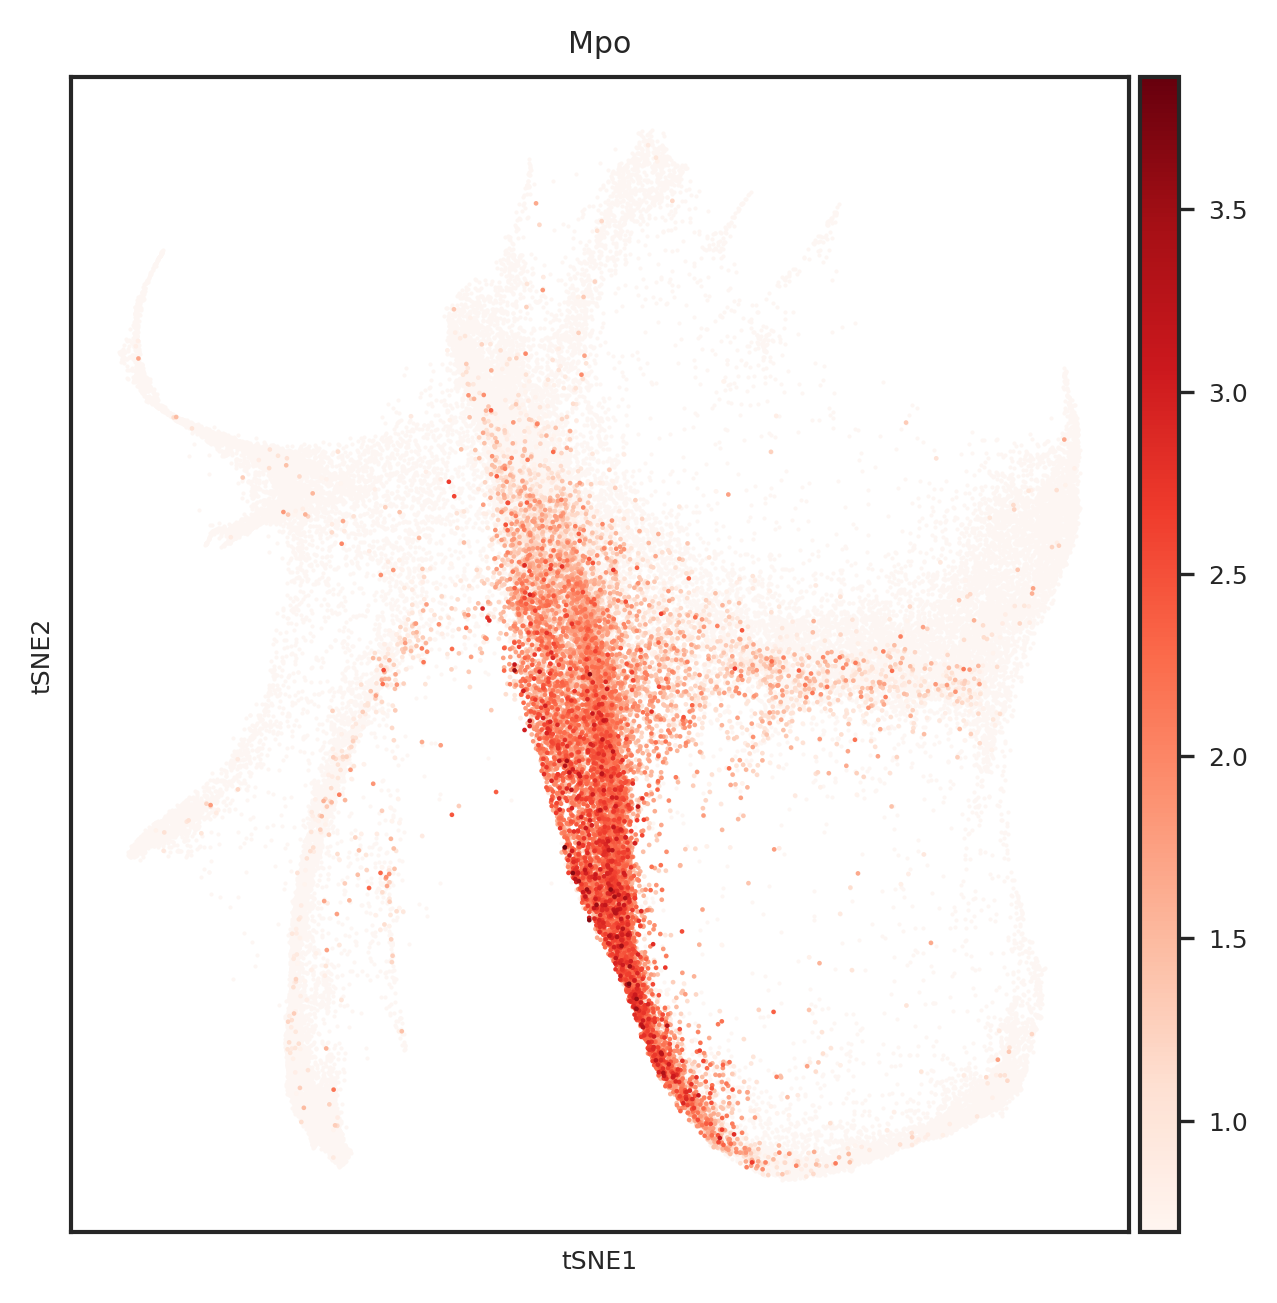
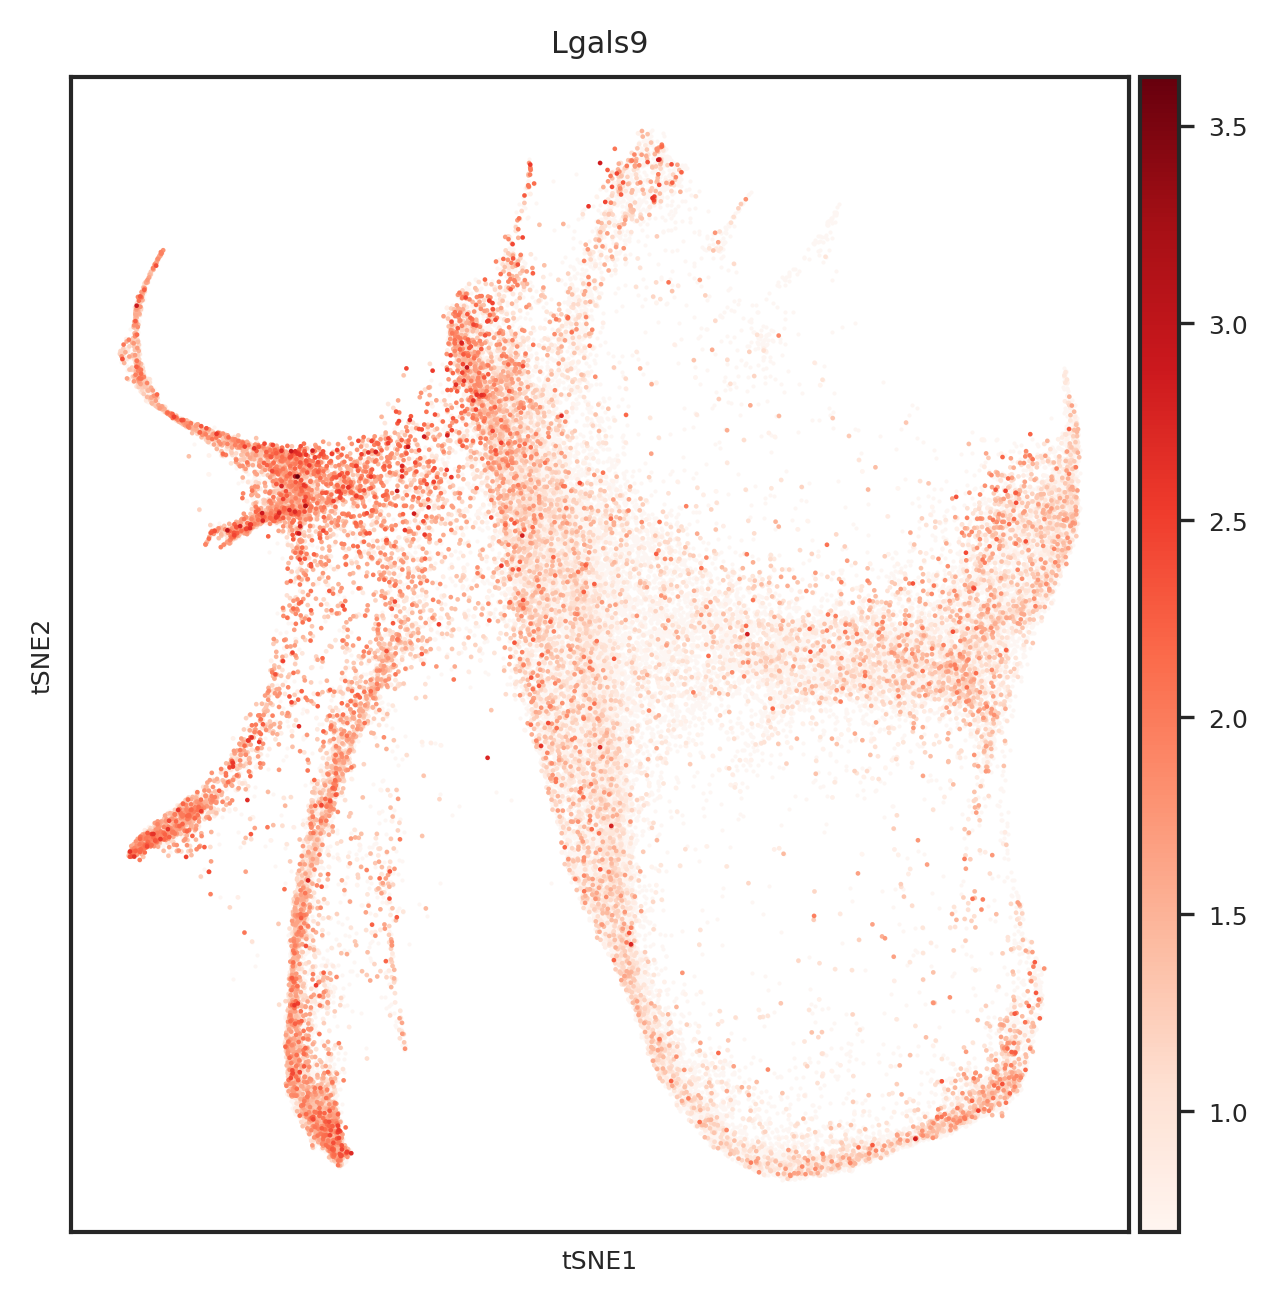
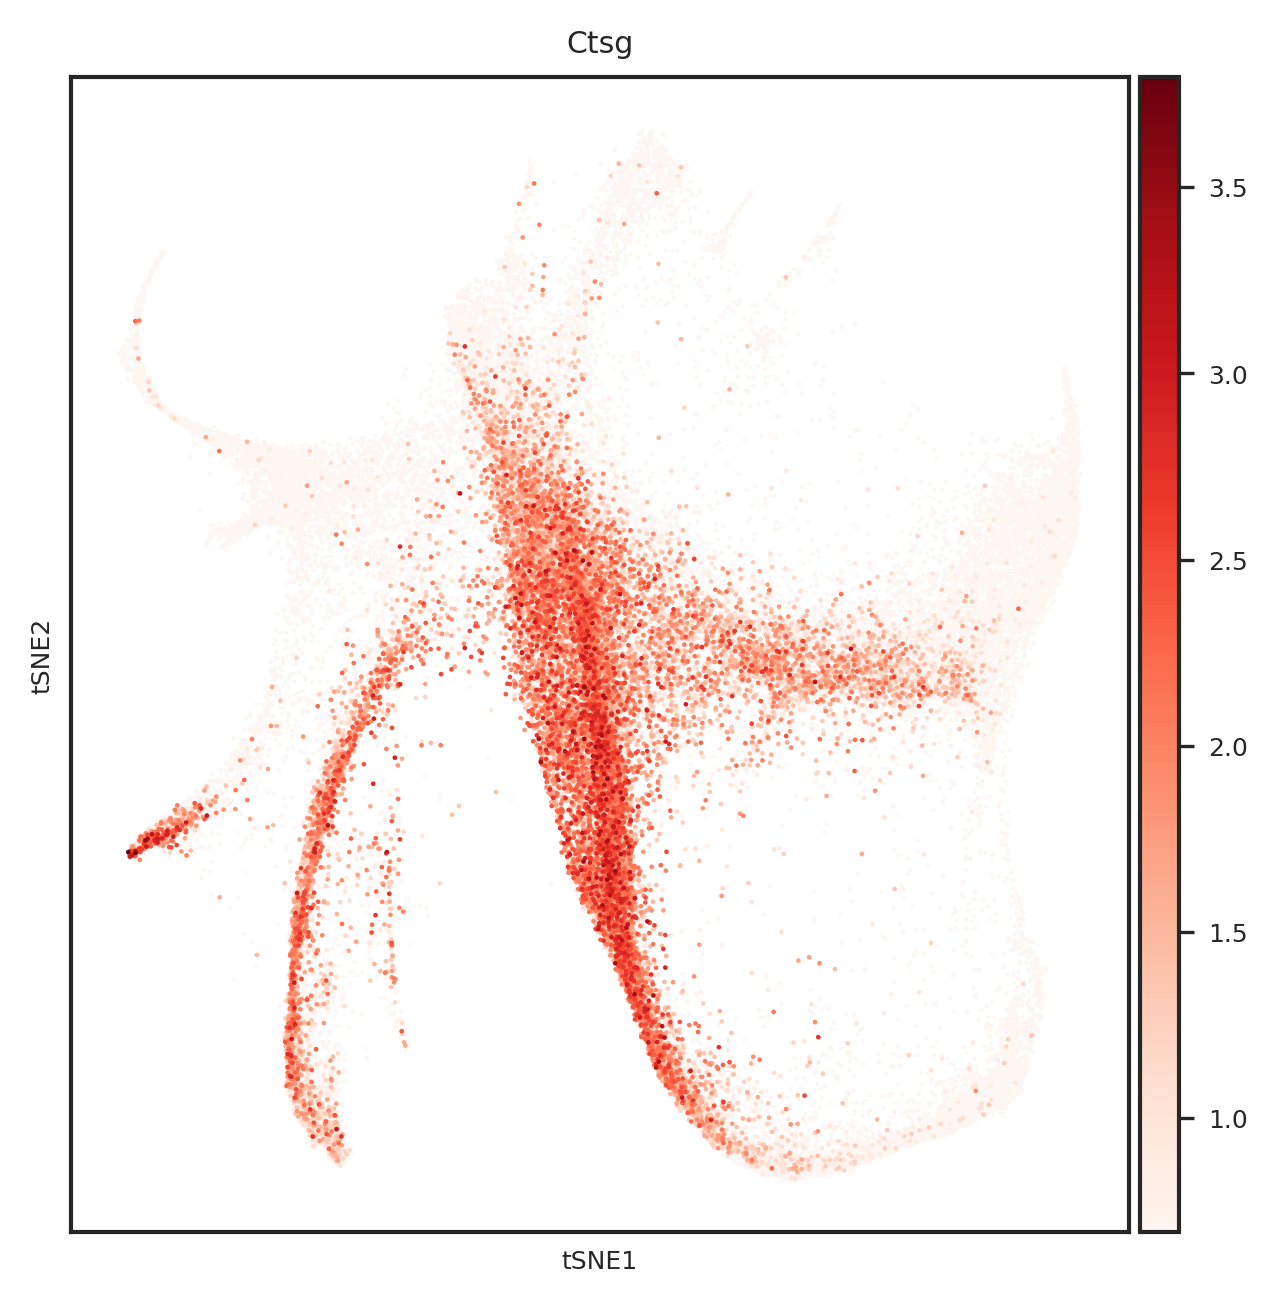
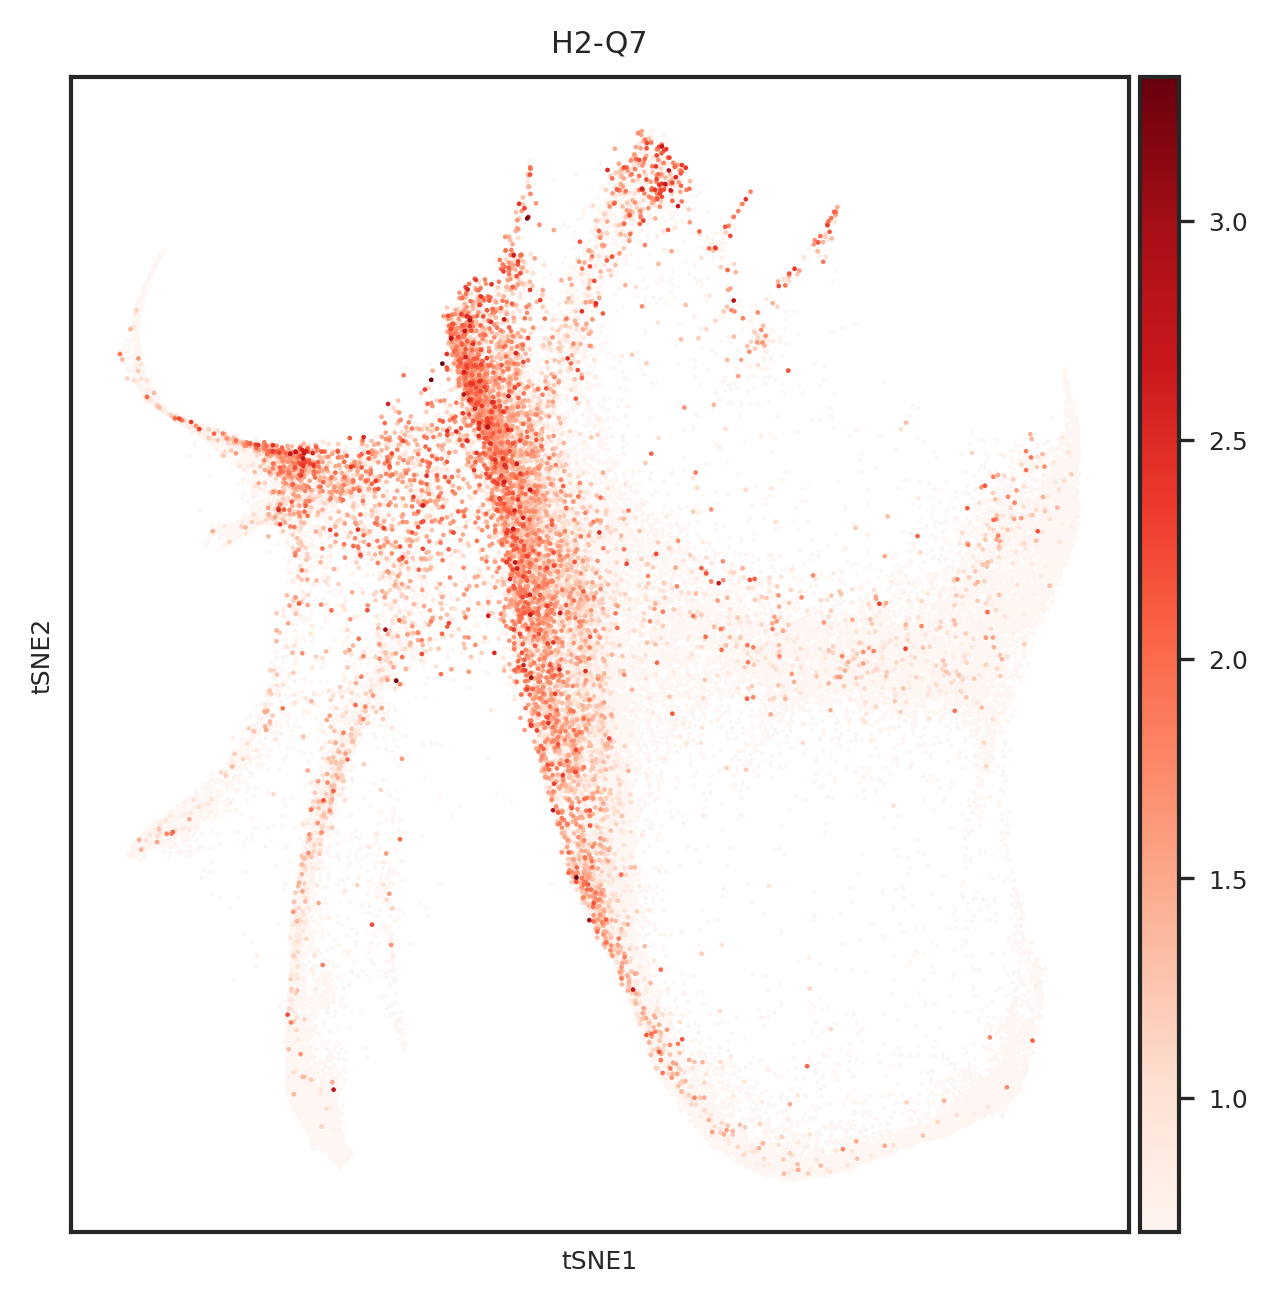
[865]:
import matplotlib.pyplot as plt
from matplotlib.backends.backend_pdf import PdfPages
#adata.obsm["X_tsne"] = sc.read_h5ad("../1.8_weinreb_forziwei.h5ad").obsm["X_emb_old"]
def create_umap_for_gene(adata, gene_name):
    fig, ax = plt.subplots()
    fig.set_size_inches(5, 5)
    ax.scatter(
        adata.obsm["X_tsne"][:, 0],
        adata.obsm["X_tsne"][:, 1],
        s=1,
        linewidths=0,
        color='#FDF6F3'
    )
    sc.pl.tsne(
        adata[adata.X[:, list(adata.var.index).index(gene_name)] > 0], ax=ax,
        color=gene_name,
        cmap='Reds',
        s=5
    )
    return fig

# 创建一个PDF文件
with PdfPages('top20genes_plots_weinreb_embedding.pdf') as pdf:
    for gene_name in top_genes:
        fig = create_umap_for_gene(adata, gene_name)
        pdf.savefig(fig)
        plt.close(fig)


[110]:
# f_read = open('/home/zhengtuo/songtao/DestinyNet/weinreb_2.22_fate_and_prob/dic_fate_weinreb_ourmodel_allundiff.pkl', 'rb')
# a = pickle.load(f_read)
# adata.obs['fate_pred']=None
# adata.obs['fate_pred']=adata.obs['index'].map(a)
# adata3=adata[adata.obs['fate_pred'].isin([0,1])].copy()
# adata3.obs['fate_pred'] = adata3.obs['fate_pred'].astype('category')
f_read = open('./dic_fate_weinreb_ourmodel_allundiff.pkl', 'rb')
a = pickle.load(f_read)
adata.obs['fate_pred']=None
adata.obs['fate_pred']=adata.obs['index'].map(a)
adata3=adata[adata.obs['fate_pred'].isin([0,1])].copy()
adata3.obs['fate_pred'] = adata3.obs['fate_pred'].astype('category')
sc.tl.rank_genes_groups(adata3, groupby='fate_pred', method='wilcoxon')
[111]:
# adata3=adata[adata.obs['GT'].isin([0,1])].copy()
# adata3.obs['fate_pred'] = adata3.obs['fate_pred'].astype('category')
# adata3.obs['GT'] = adata3.obs['GT'].astype('category')
# sc.tl.rank_genes_groups(adata3, groupby='GT', method='wilcoxon')
threshold_pval=0.05
def get_marker_genes(adata, label_value, threshold_pval=0.05):
    names_df = pd.DataFrame(adata.uns['rank_genes_groups']['names'])
    logfoldchanges_df = pd.DataFrame(adata.uns['rank_genes_groups']['logfoldchanges'])
    pvals_adj_df = pd.DataFrame(adata.uns['rank_genes_groups']['pvals_adj'])

    return set(names_df[label_value].loc[
        (logfoldchanges_df[label_value] > 1) &
        (pvals_adj_df[label_value] < threshold_pval)
    ])

Mo_marker = get_marker_genes(adata3, '0.0')
Neu_marker = get_marker_genes(adata3, '1.0')
d = Mo_marker.union(Neu_marker)
[112]:
print(len(Mo_marker))
print(len(Neu_marker))
109
90
[113]:
import gseapy
adata3.obs['fate_pred']=adata3.obs['fate_pred'].astype('category')
# sc.tl.rank_genes_groups(adata, groupby=groupby, method="wilcoxon", key_added='rank_genes_test',
#                         groups=[1.0], reference=0.0)
# deg_tex = pd.DataFrame(np.hstack([
#     np.array(list(map(list, adata.uns["rank_genes_test"]["names"]))),
#     np.array(list(map(list, adata.uns["rank_genes_test"]['logfoldchanges']))),
#     np.array(list(map(list, adata.uns["rank_genes_test"]['pvals_adj'])))
# ]),
#         columns = list(range(3))
# )
deg_tex_up =Neu_marker
deg_tex_dw =Mo_marker

enr_tex_up = gseapy.enrichr(gene_list=list(deg_tex_up),
                            organism='Mouse',
                            gene_sets='GO_Biological_Process_2021')
enr_tex_dw = gseapy.enrichr(gene_list=list(deg_tex_dw),
                            organism='Mouse',
                            gene_sets='GO_Biological_Process_2021')

# return diff_exp_genes,diff_exp_genes_up,diff_exp_genes_dw,enr_res_up,enr_res_dw
# adata3.obs['fate_pred']=adata3.obs['fate_pred'].astype('category')
# #sc.tl.rank_genes_groups(adata3, groupby='fate_pred', method="wilcoxon", key_added='rank_genes_test',groups=[1.0],reference=0.0)
# deg_tex,deg_tex_up,deg_tex_dw,enr_tex_up,enr_tex_dw = DEG_analysis(adata3, groupby='fate_pred',
#                                                                    query_subtype=1.0,
#                                                                    reference_subtype=0.0)
/home/zhengtuo/miniconda3/lib/python3.9/site-packages/gseapy/enrichr.py:335: FutureWarning: The frame.append method is deprecated and will be removed from pandas in a future version. Use pandas.concat instead.
  self.results = self.results.append(res, ignore_index=True, sort=True)
/home/zhengtuo/miniconda3/lib/python3.9/site-packages/gseapy/enrichr.py:335: FutureWarning: The frame.append method is deprecated and will be removed from pandas in a future version. Use pandas.concat instead.
  self.results = self.results.append(res, ignore_index=True, sort=True)
[753]:
len(deg_tex_up)
[753]:
700
[754]:
len(deg_tex_dw)
[754]:
246
[812]:
enr_tex_up.res2d['Genes'][15]
[812]:
'HSP90AB1;MS4A3;SLC2A3;PYGL;MPO;HK3;CTSG;CD93;ANXA3;GAA;ATP6AP2;NME2;RHOG;ATP11B;TNFRSF1B;DDOST;VAMP8;EEF1A1;RAB31;PECAM1;PRTN3;PPIA;S100A8;VCL;CD63;CAB39;CLEC12A;FGL2;AGPAT2;PLAC8;ADGRG3;ALOX5;CREG1;NEU1;MLEC;STOM;LTA4H;RAB6A;ELANE;S100A11;VAT1;TMEM30A;IDH1;SURF4;TUBB4B;EEF2;PRDX6;ERP44;IMPDH1;LAMTOR2;YPEL5'
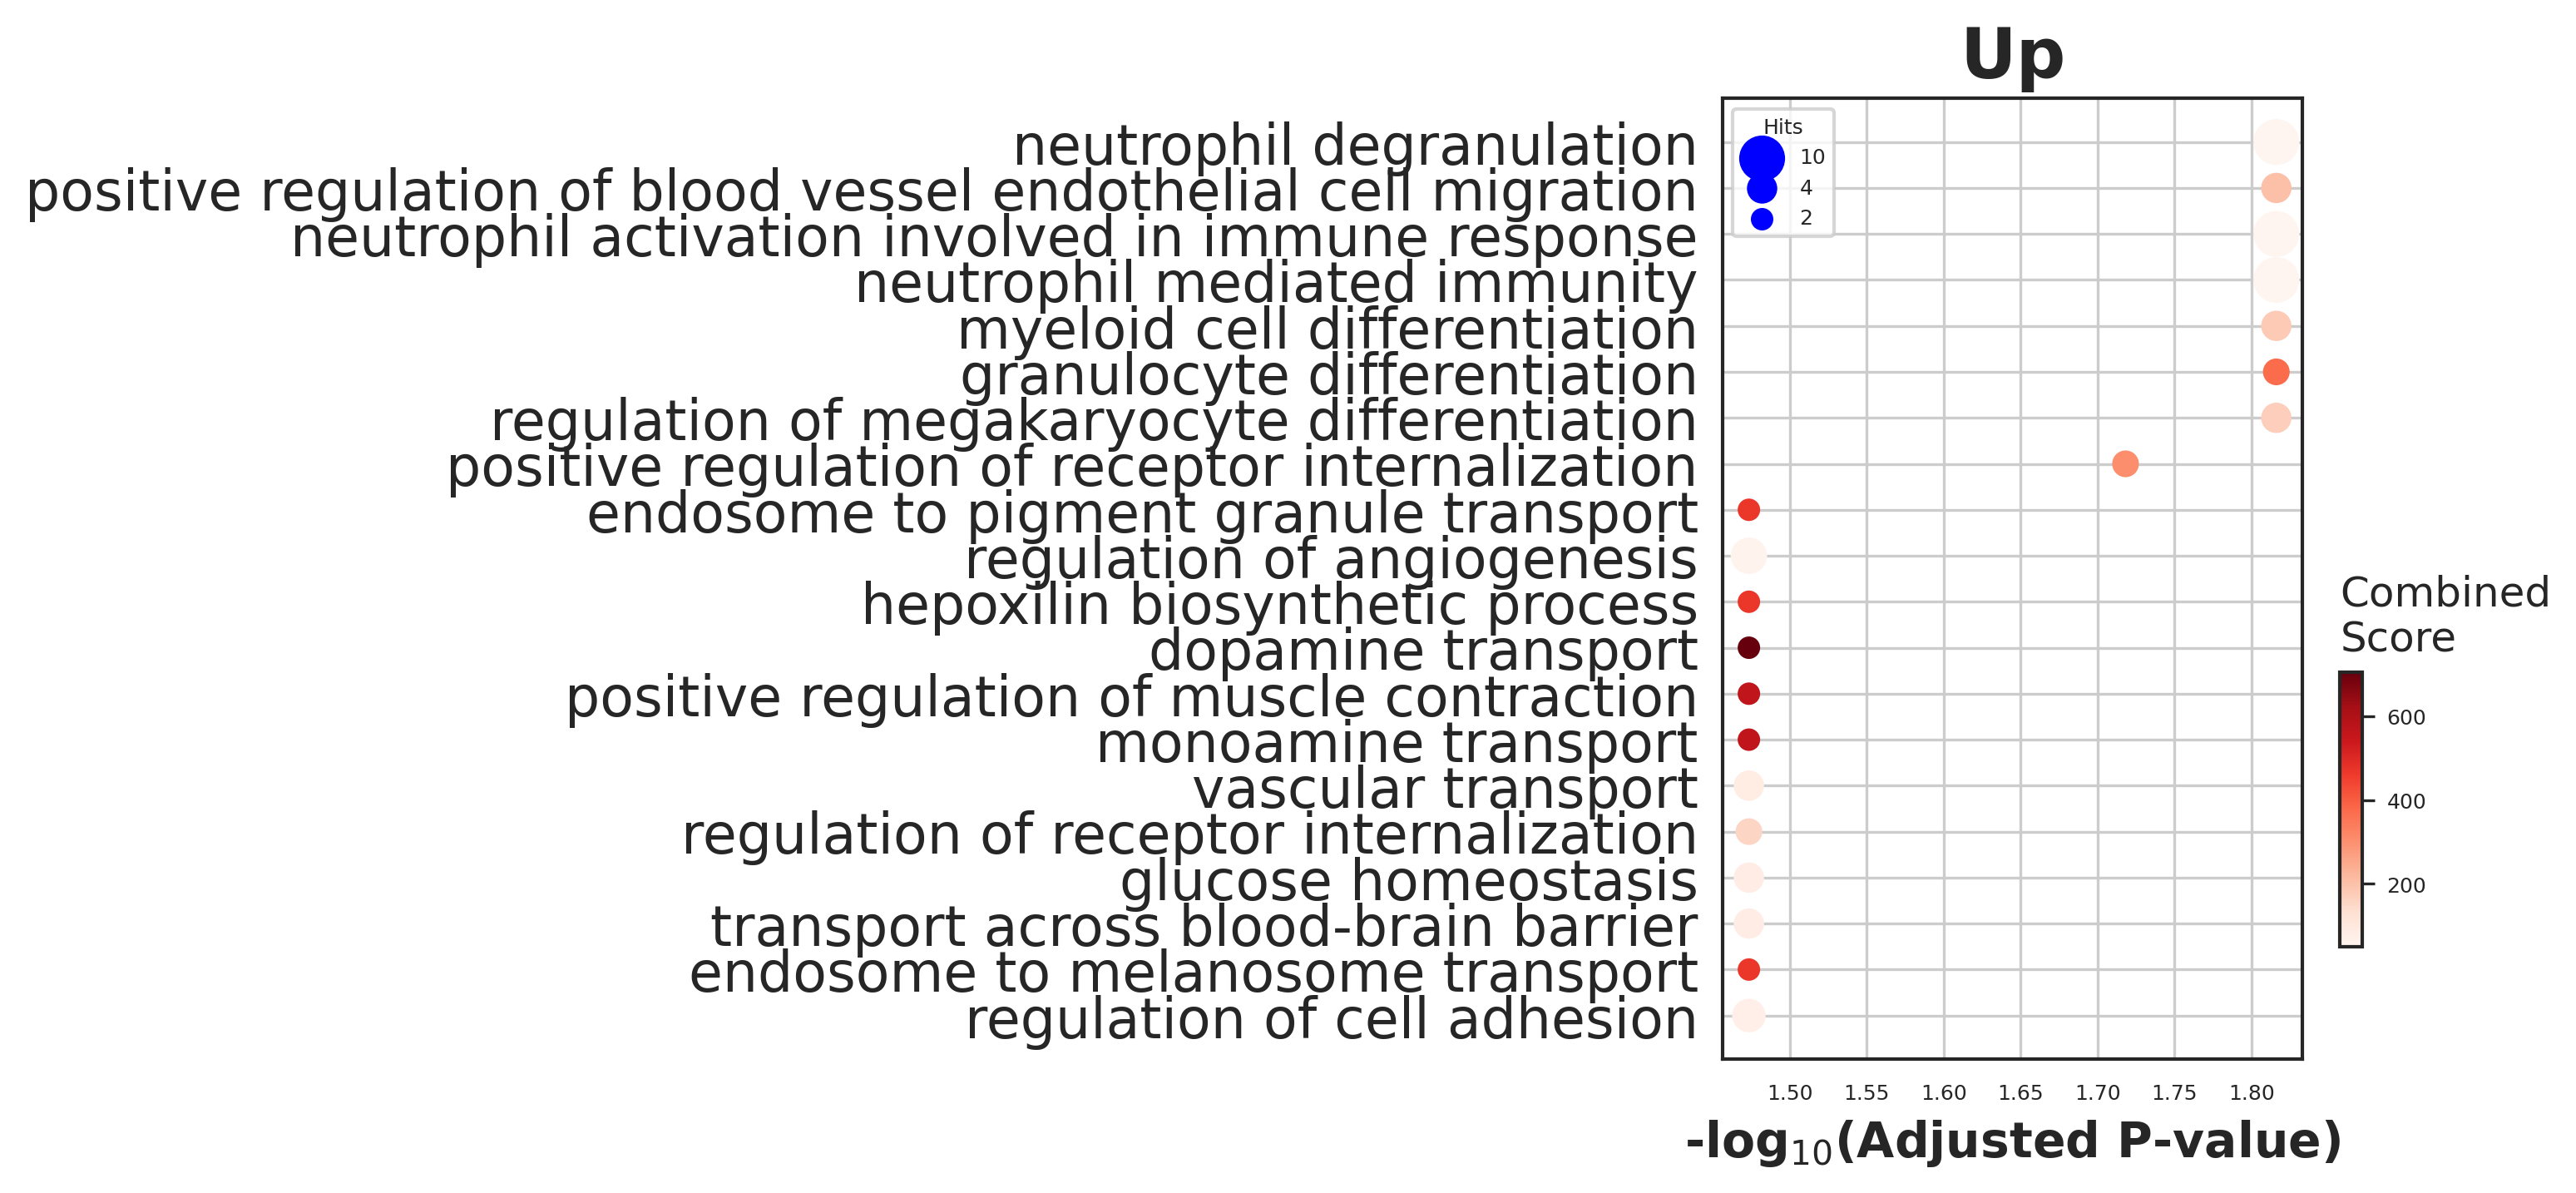
[115]:
enr_tex_up.res2d.Term = enr_tex_up.res2d.Term.str.split(" \(GO").str[0]
# dotplot
gseapy.dotplot(enr_tex_up.res2d[0:20], size=10, title="Up",
               top_term=20,
               cmap='Reds', figsize=(3,5))
fig = plt.gcf()

with PdfPages('./figures/GT_pred_up.pdf') as pdf:
    pdf.savefig(fig, bbox_inches='tight')
plt.show()
/home/zhengtuo/miniconda3/lib/python3.9/site-packages/gseapy/plot.py:282: SettingWithCopyWarning:
A value is trying to be set on a copy of a slice from a DataFrame.
Try using .loc[row_indexer,col_indexer] = value instead

See the caveats in the documentation: https://pandas.pydata.org/pandas-docs/stable/user_guide/indexing.html#returning-a-view-versus-a-copy
  df.loc[:, colname] = df[colname].map(float)
[816]:
genes_1 = set(enr_tex_dw.res2d['Genes'][0].split(","))
genes_2 = set(enr_tex_up.res2d['Genes'][15].split(","))
overlapping_genes = genes_1.intersection(genes_2)
overlapping_genes
[816]:
set()
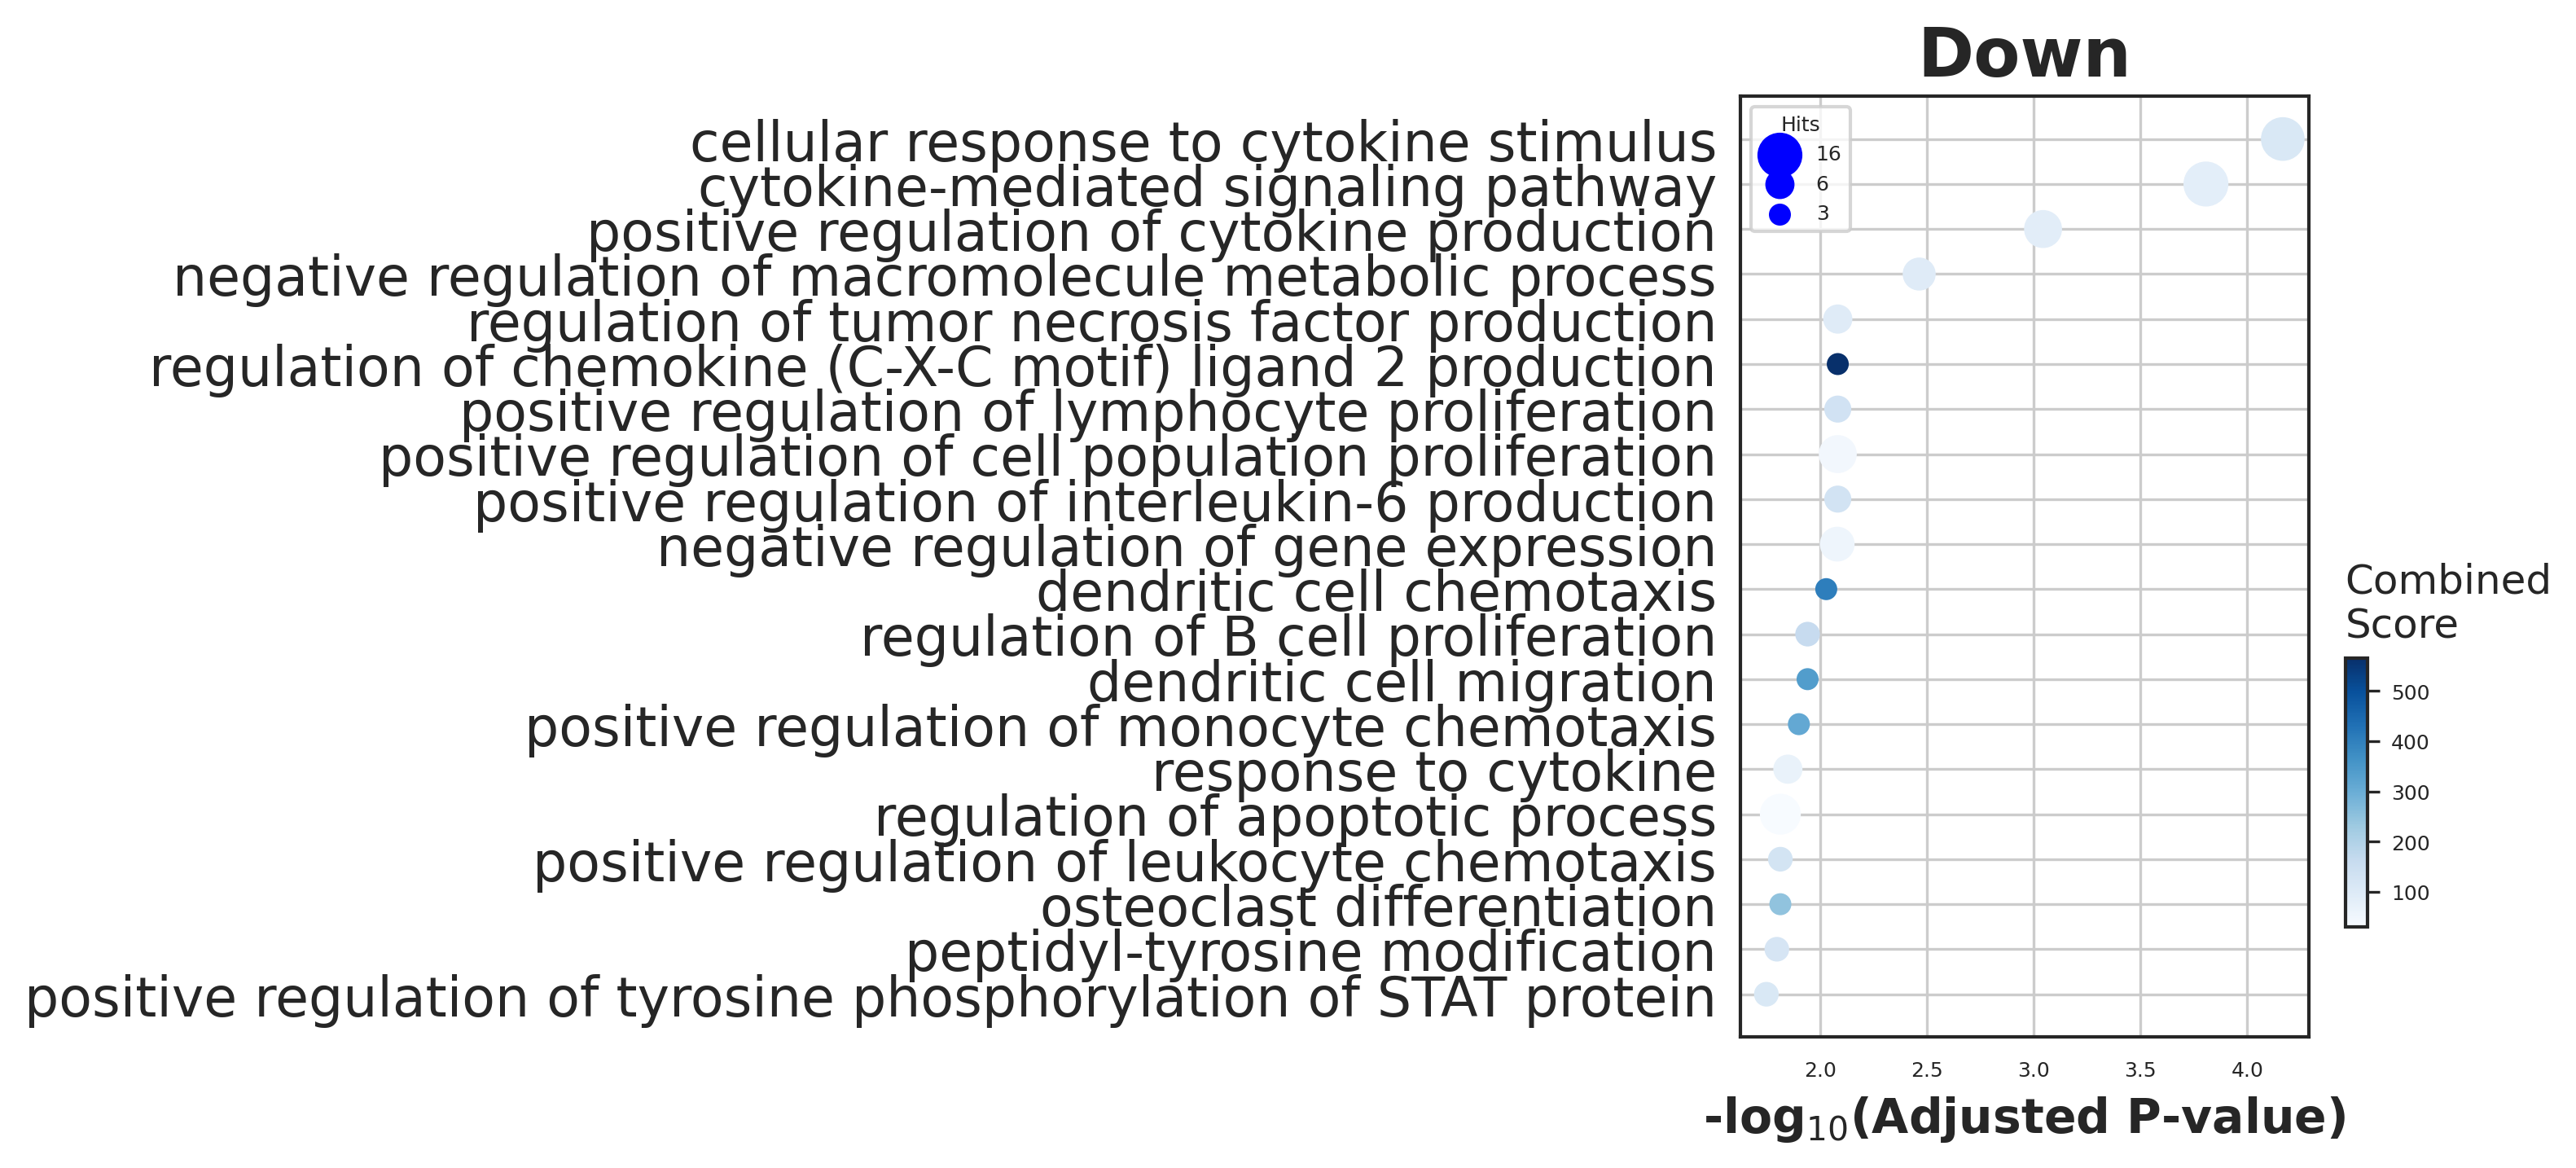
[116]:
# Figure2C
# trim (go:...)
enr_tex_dw.res2d.Term = enr_tex_dw.res2d.Term.str.split(" \(GO").str[0]
# dotplot
gseapy.dotplot(enr_tex_dw.res2d[0:20], size=12, top_term=20,
               figsize=(3,5), title="Down", cmap='Blues')

fig = plt.gcf()

with PdfPages('./figures/GT_pred_down.pdf') as pdf:
    pdf.savefig(fig, bbox_inches='tight')
plt.show()
/home/zhengtuo/miniconda3/lib/python3.9/site-packages/gseapy/plot.py:282: SettingWithCopyWarning:
A value is trying to be set on a copy of a slice from a DataFrame.
Try using .loc[row_indexer,col_indexer] = value instead

See the caveats in the documentation: https://pandas.pydata.org/pandas-docs/stable/user_guide/indexing.html#returning-a-view-versus-a-copy
  df.loc[:, colname] = df[colname].map(float)
[24]:
gradients_per_label
[24]:
{0: tensor([7.1293e-09, 6.4681e-08, 3.2634e-08,  ..., 9.6019e-08, 4.2670e-07,
         1.2204e-08], device='cuda:1'),
 1: tensor([9.1898e-09, 5.8025e-08, 2.9834e-08,  ..., 8.4796e-08, 3.7161e-07,
         1.0011e-08], device='cuda:1')}
[23]:
import seaborn as sns
import pandas as pd
from torch.utils.data import DataLoader, TensorDataset
from torch.autograd import Variable
def compute_gradients_for_label(target_label, data, model_encoder, model_decoder):
    mask = data.obs['fate_pred'] == target_label
    filtered_data = data[mask]

    geneex_data = torch.tensor(filtered_data.raw.X.toarray(), dtype=torch.float32).to(device2)

    dataset = TensorDataset(geneex_data)
    dataloader = DataLoader(dataset, batch_size=256, shuffle=False)

    total_gradients = torch.zeros(len_geneExp).to(device2)
    for batch in dataloader:
        geneExp = batch[0]
        geneExp = Variable(geneExp, requires_grad=True)
        output_data = model_encoder(geneExp)
        output_data = model_decoder(output_data)

        loss_function = nn.MSELoss()
        loss = loss_function(output_data, geneExp)

        model_encoder.zero_grad()
        model_decoder.zero_grad()
        loss.backward()

        total_gradients += geneExp.grad.abs().mean(dim=0)

    average_gradients = total_gradients / len(dataloader)
    return average_gradients

labels = [0, 1]
gradients_per_label = {}

for label in labels:
    gradients_per_label[label] = compute_gradients_for_label(label, adata, geneEnc, geneDec)
[29]:
num_key_genes = 30

key_genes_per_label = {}

for label, gradients in gradients_per_label.items():
    df = pd.DataFrame({
        'gene_ids': adata.var.index.values,
        'importance': gradients.cpu().detach().numpy()
    })

    sorted_df = df.sort_values(by="importance", ascending=False)

    key_genes = sorted_df['gene_ids'].head(num_key_genes).tolist()
    key_genes_per_label[label] = key_genes

# 输出每个标签的关键基因
for label, genes in key_genes_per_label.items():
    print(f"Key genes for label {label}:")
    print(', '.join(genes))
    print("\n")
Key genes for label 0:
mt-Co2, mt-Atp6, mt-Nd1, mt-Co1, Eef1a1, mt-Nd4, Gapdh, mt-Cytb, H2afy, Ppia, Rpl23, Ptma, Tuba1b, Ybx1, Rps23, Actg1, mt-Nd2, Set, Srgn, Rpl12, Rpl4, Actb, Npm1, Pabpc1, Ifitm1, Eif4g2, Rps17, Rpl7, Rps16, Rps24


Key genes for label 1:
mt-Co2, mt-Atp6, mt-Nd1, Eef1a1, mt-Co1, Gapdh, mt-Nd4, mt-Cytb, Srgn, Rpl23, Ppia, Rps23, Ybx1, Actg1, Ptma, H2afy, Rpl12, mt-Nd2, Tuba1b, Rpl4, Npm1, Pabpc1, Rps17, Set, Rps24, Ifitm1, Rpl7, Actb, Rpl27a, Rps16
[14]:
# adata.obsm['X_pca']=adata.obsm['X_pca'].cpu().numpy()
df_gradients_all['diff'].abs().nlargest(50).index
[14]:
Index(['Srgn', 'Elane', 'Mpo', 'Ctsg', 'Gstm1', 'Ly6a', 'Calr', 'Prtn3',
       'Fth1', 'H2-Q7', 'Gfi1', 'Ap3s1', 'Igf1r', 'Itm2b', 'Ifi203', 'Cybb',
       'Hk3', 'Spp1', 'Lpl', 'Cd63', 'Psap', 'Muc13', 'Rpl37a', 'Ctsc',
       'Plac8', 'Rps17', 'Anxa3', 'Gas5', 'Rbms1', '2810417H13Rik', 'Tpm4',
       'Ighm', 'Gpx1', 'Rps24', 'Dstn', 'Rpl23', 'Gsr', 'Spint2', 'Thy1',
       'Casp6', 'Lta4h', 'Rpl26', 'Sh3bgrl3', 'Tmbim6', 'Rps23', 'Rpsa',
       'Rpl27a', 'Rps19', 'Cd44', 'Rps10'],
      dtype='object')
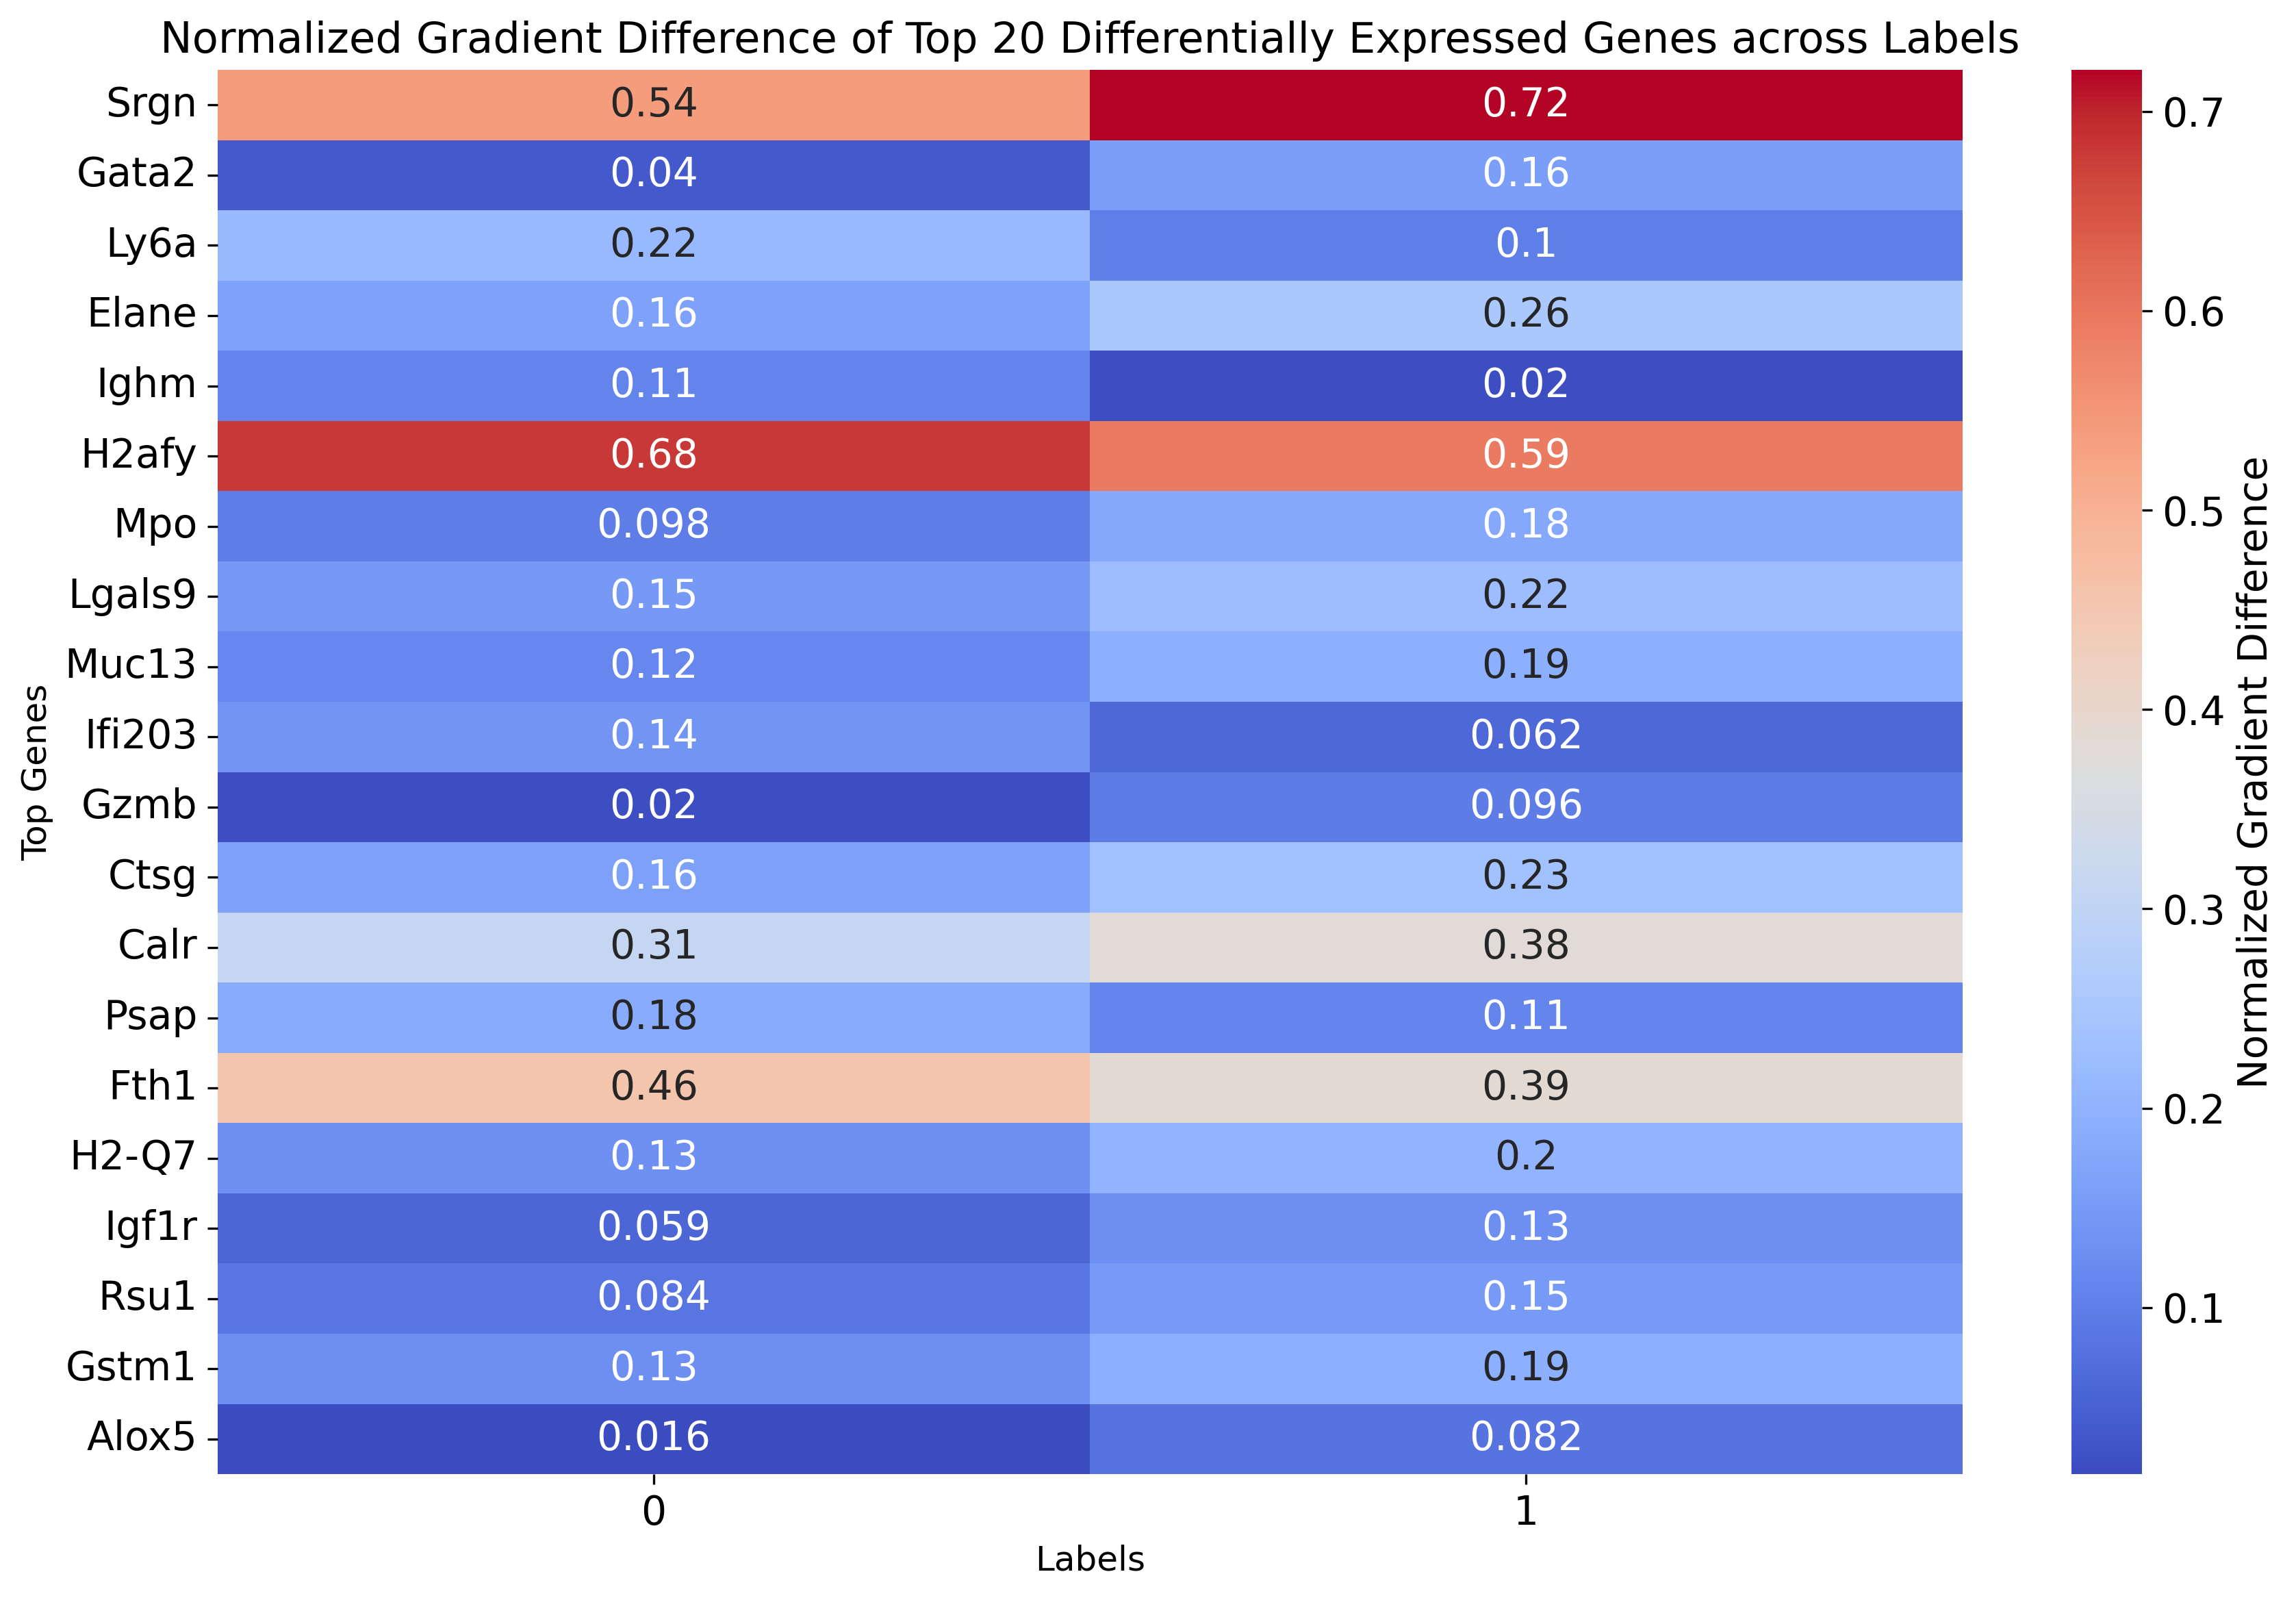
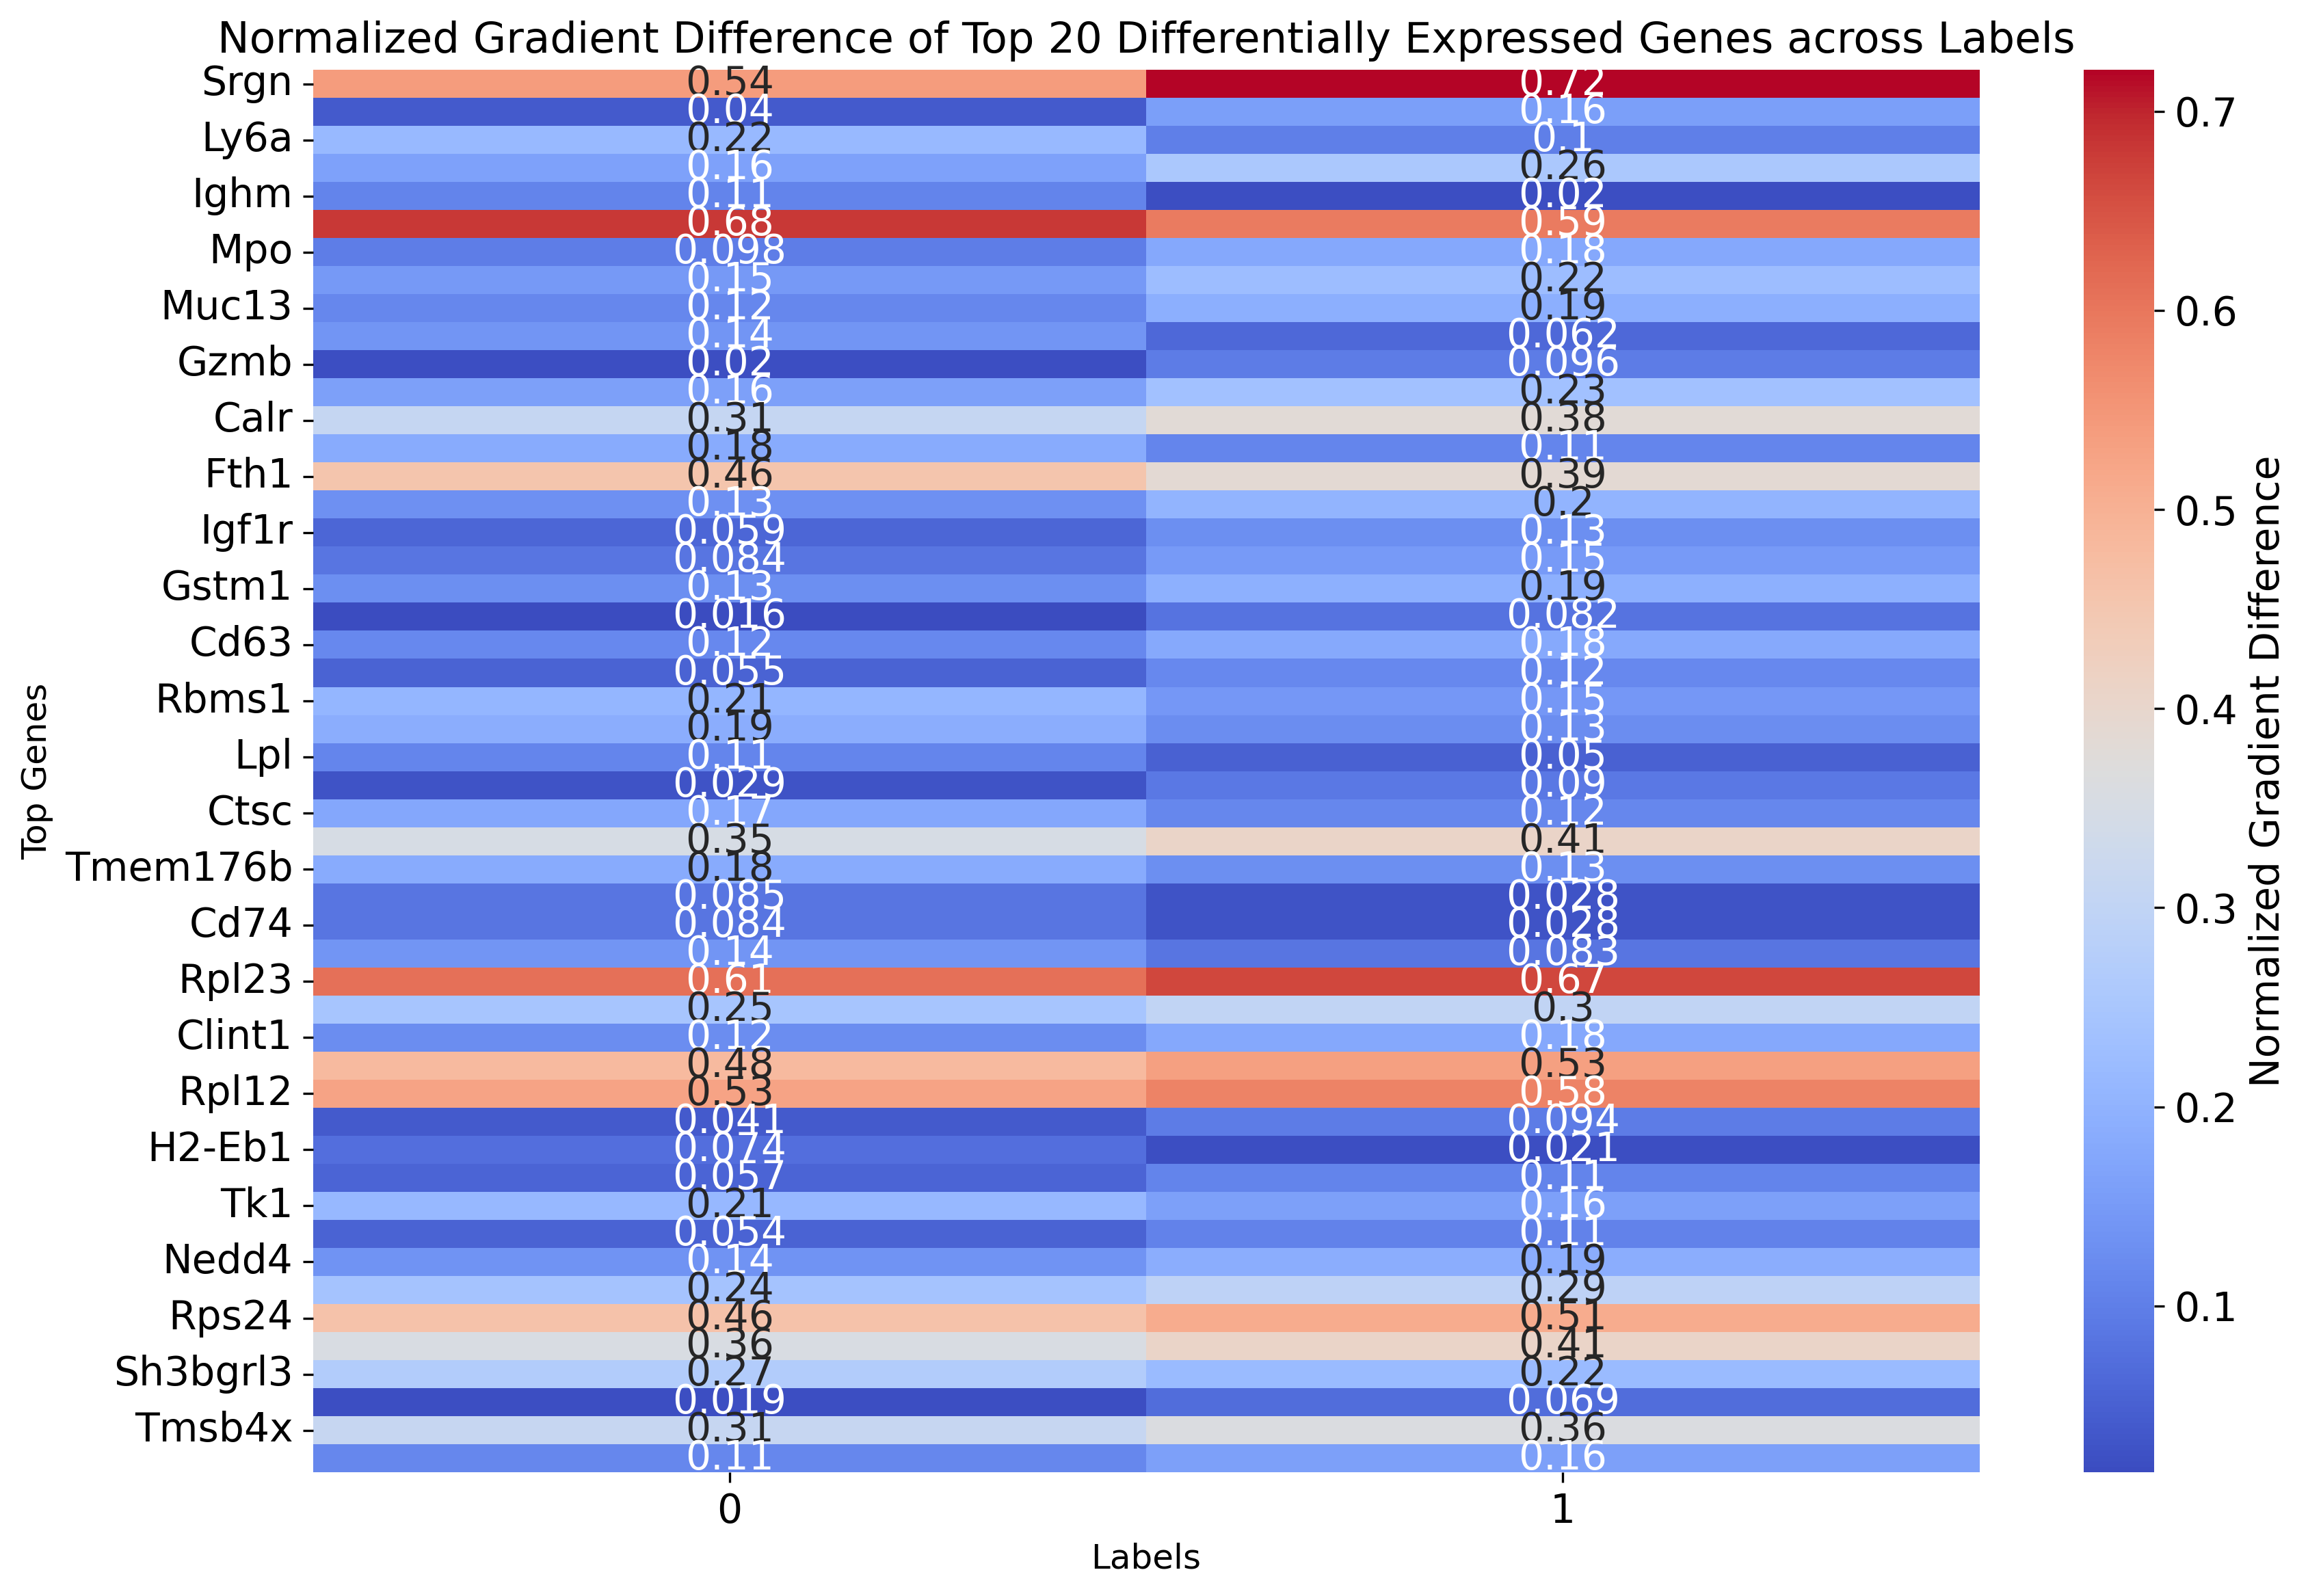
[86]:
gradient_data = {}
for label, gradients in gradients_per_label.items():
    gradient_data[label] = gradients.cpu().detach().numpy()

# 转为DataFrame
df_gradients_all = pd.DataFrame(gradient_data, index=adata.var.index.values)

def normalize(column):
    """Normalize a pandas column to range between 0 and 1"""
    min_val = column.min()
    max_val = column.max()
    return (column - min_val) / (max_val - min_val)

# Normalize gradients for each label
for label in labels:
    df_gradients_all[label] = normalize(df_gradients_all[label])

# Compute difference between normalized gradients for the two labels
df_gradients_all['diff'] = df_gradients_all[labels[0]] - df_gradients_all[labels[1]]

# Select the top 20 genes with the largest gradient difference
top_genes = df_gradients_all['diff'].abs().nlargest(20).index

# Extract the normalized gradient values for the top genes
df_gradient_top = df_gradients_all.loc[top_genes, labels]

# Plot heatmap
plt.figure(figsize=(12, 8))
sns.heatmap(df_gradient_top, cmap="coolwarm", annot=True, cbar_kws={'label': 'Normalized Gradient Difference'})
plt.title("Normalized Gradient Difference of Top 20 Differentially Expressed Genes across Labels", fontsize=15)
plt.ylabel('Top Genes', fontsize=12)
plt.xlabel('Labels', fontsize=12)
plt.tight_layout()
plt.show()
[85]:
df_gradient_top
# df_gradient_top.to_csv('./weinreb_top50.csv')
[85]:
| 0 | 1 | |
|---|---|---|
| Srgn | 0.540197 | 0.720850 |
| Gata2 | 0.040284 | 0.158828 |
| Ly6a | 0.215512 | 0.101576 |
| Elane | 0.163360 | 0.255346 |
| Ighm | 0.109224 | 0.020179 |
| H2afy | 0.681413 | 0.593418 |
| Mpo | 0.097797 | 0.176222 |
| Lgals9 | 0.146582 | 0.223989 |
| Muc13 | 0.115342 | 0.191869 |
| Ifi203 | 0.138005 | 0.061555 |
| Gzmb | 0.020378 | 0.096122 |
| Ctsg | 0.160164 | 0.234527 |
| Calr | 0.310392 | 0.382003 |
| Psap | 0.183319 | 0.112002 |
| Fth1 | 0.456394 | 0.385800 |
| H2-Q7 | 0.130340 | 0.200920 |
| Igf1r | 0.059137 | 0.127686 |
| Rsu1 | 0.083553 | 0.149635 |
| Gstm1 | 0.128448 | 0.194066 |
| Alox5 | 0.016399 | 0.081993 |
| Cd63 | 0.116019 | 0.179740 |
| Nt5c3 | 0.054703 | 0.117510 |
| Rbms1 | 0.207719 | 0.145031 |
| Nfkbia | 0.188631 | 0.126453 |
| Lpl | 0.111949 | 0.050364 |
| F2r | 0.028852 | 0.089945 |
| Ctsc | 0.173801 | 0.115267 |
| Rpl37a | 0.349934 | 0.408366 |
| Tmem176b | 0.183777 | 0.127356 |
| H2-Aa | 0.084571 | 0.028233 |
| Cd74 | 0.083975 | 0.027706 |
| Cybb | 0.138917 | 0.082854 |
| Rpl23 | 0.610108 | 0.665414 |
| Rpn1 | 0.246744 | 0.301163 |
| Clint1 | 0.124384 | 0.178549 |
| Rps17 | 0.479229 | 0.532979 |
| Rpl12 | 0.527401 | 0.581106 |
| Scin | 0.040654 | 0.094235 |
| H2-Eb1 | 0.073607 | 0.020919 |
| Hbb-bt | 0.056614 | 0.108873 |
| Tk1 | 0.211874 | 0.159731 |
| Cpne2 | 0.053908 | 0.105856 |
| Nedd4 | 0.136443 | 0.188341 |
| Ap3s1 | 0.241022 | 0.292903 |
| Rps24 | 0.459745 | 0.510892 |
| Rpsa | 0.357013 | 0.408056 |
| Sh3bgrl3 | 0.269304 | 0.219289 |
| Cyp11a1 | 0.019235 | 0.068958 |
| Tmsb4x | 0.312536 | 0.361726 |
| Spn | 0.112933 | 0.162044 |
[42]:
gradient_data = {}
for label, gradients in gradients_per_label.items():
    gradient_data[label] = gradients.cpu().detach().numpy()

df_gradients_all = pd.DataFrame(gradient_data, index=adata.var.index.values)

def normalize(column):
    """Normalize a pandas column to range between 0 and 1"""
    min_val = column.min()
    max_val = column.max()
    return (column - min_val) / (max_val - min_val)

# Normalize gradients for each label
for label in labels:
    df_gradients_all[label] = normalize(df_gradients_all[label])

# Compute difference between normalized gradients for the two labels
df_gradients_all['diff'] = df_gradients_all[labels[0]] - df_gradients_all[labels[1]]

# Select the top 20 genes with the largest gradient difference
top_genes = df_gradients_all['diff'].abs().nlargest(50).index

# Extract the normalized gradient values for the top genes
df_gradient_top = df_gradients_all.loc[top_genes, labels]

# Plot heatmap
plt.figure(figsize=(12, 8))
sns.heatmap(df_gradient_top, cmap="coolwarm", annot=True, cbar_kws={'label': 'Normalized Gradient Difference'})
plt.title("Normalized Gradient Difference of Top 20 Differentially Expressed Genes across Labels", fontsize=15)
plt.ylabel('Top Genes', fontsize=12)
plt.xlabel('Labels', fontsize=12)
plt.tight_layout()
plt.show()
[76]:
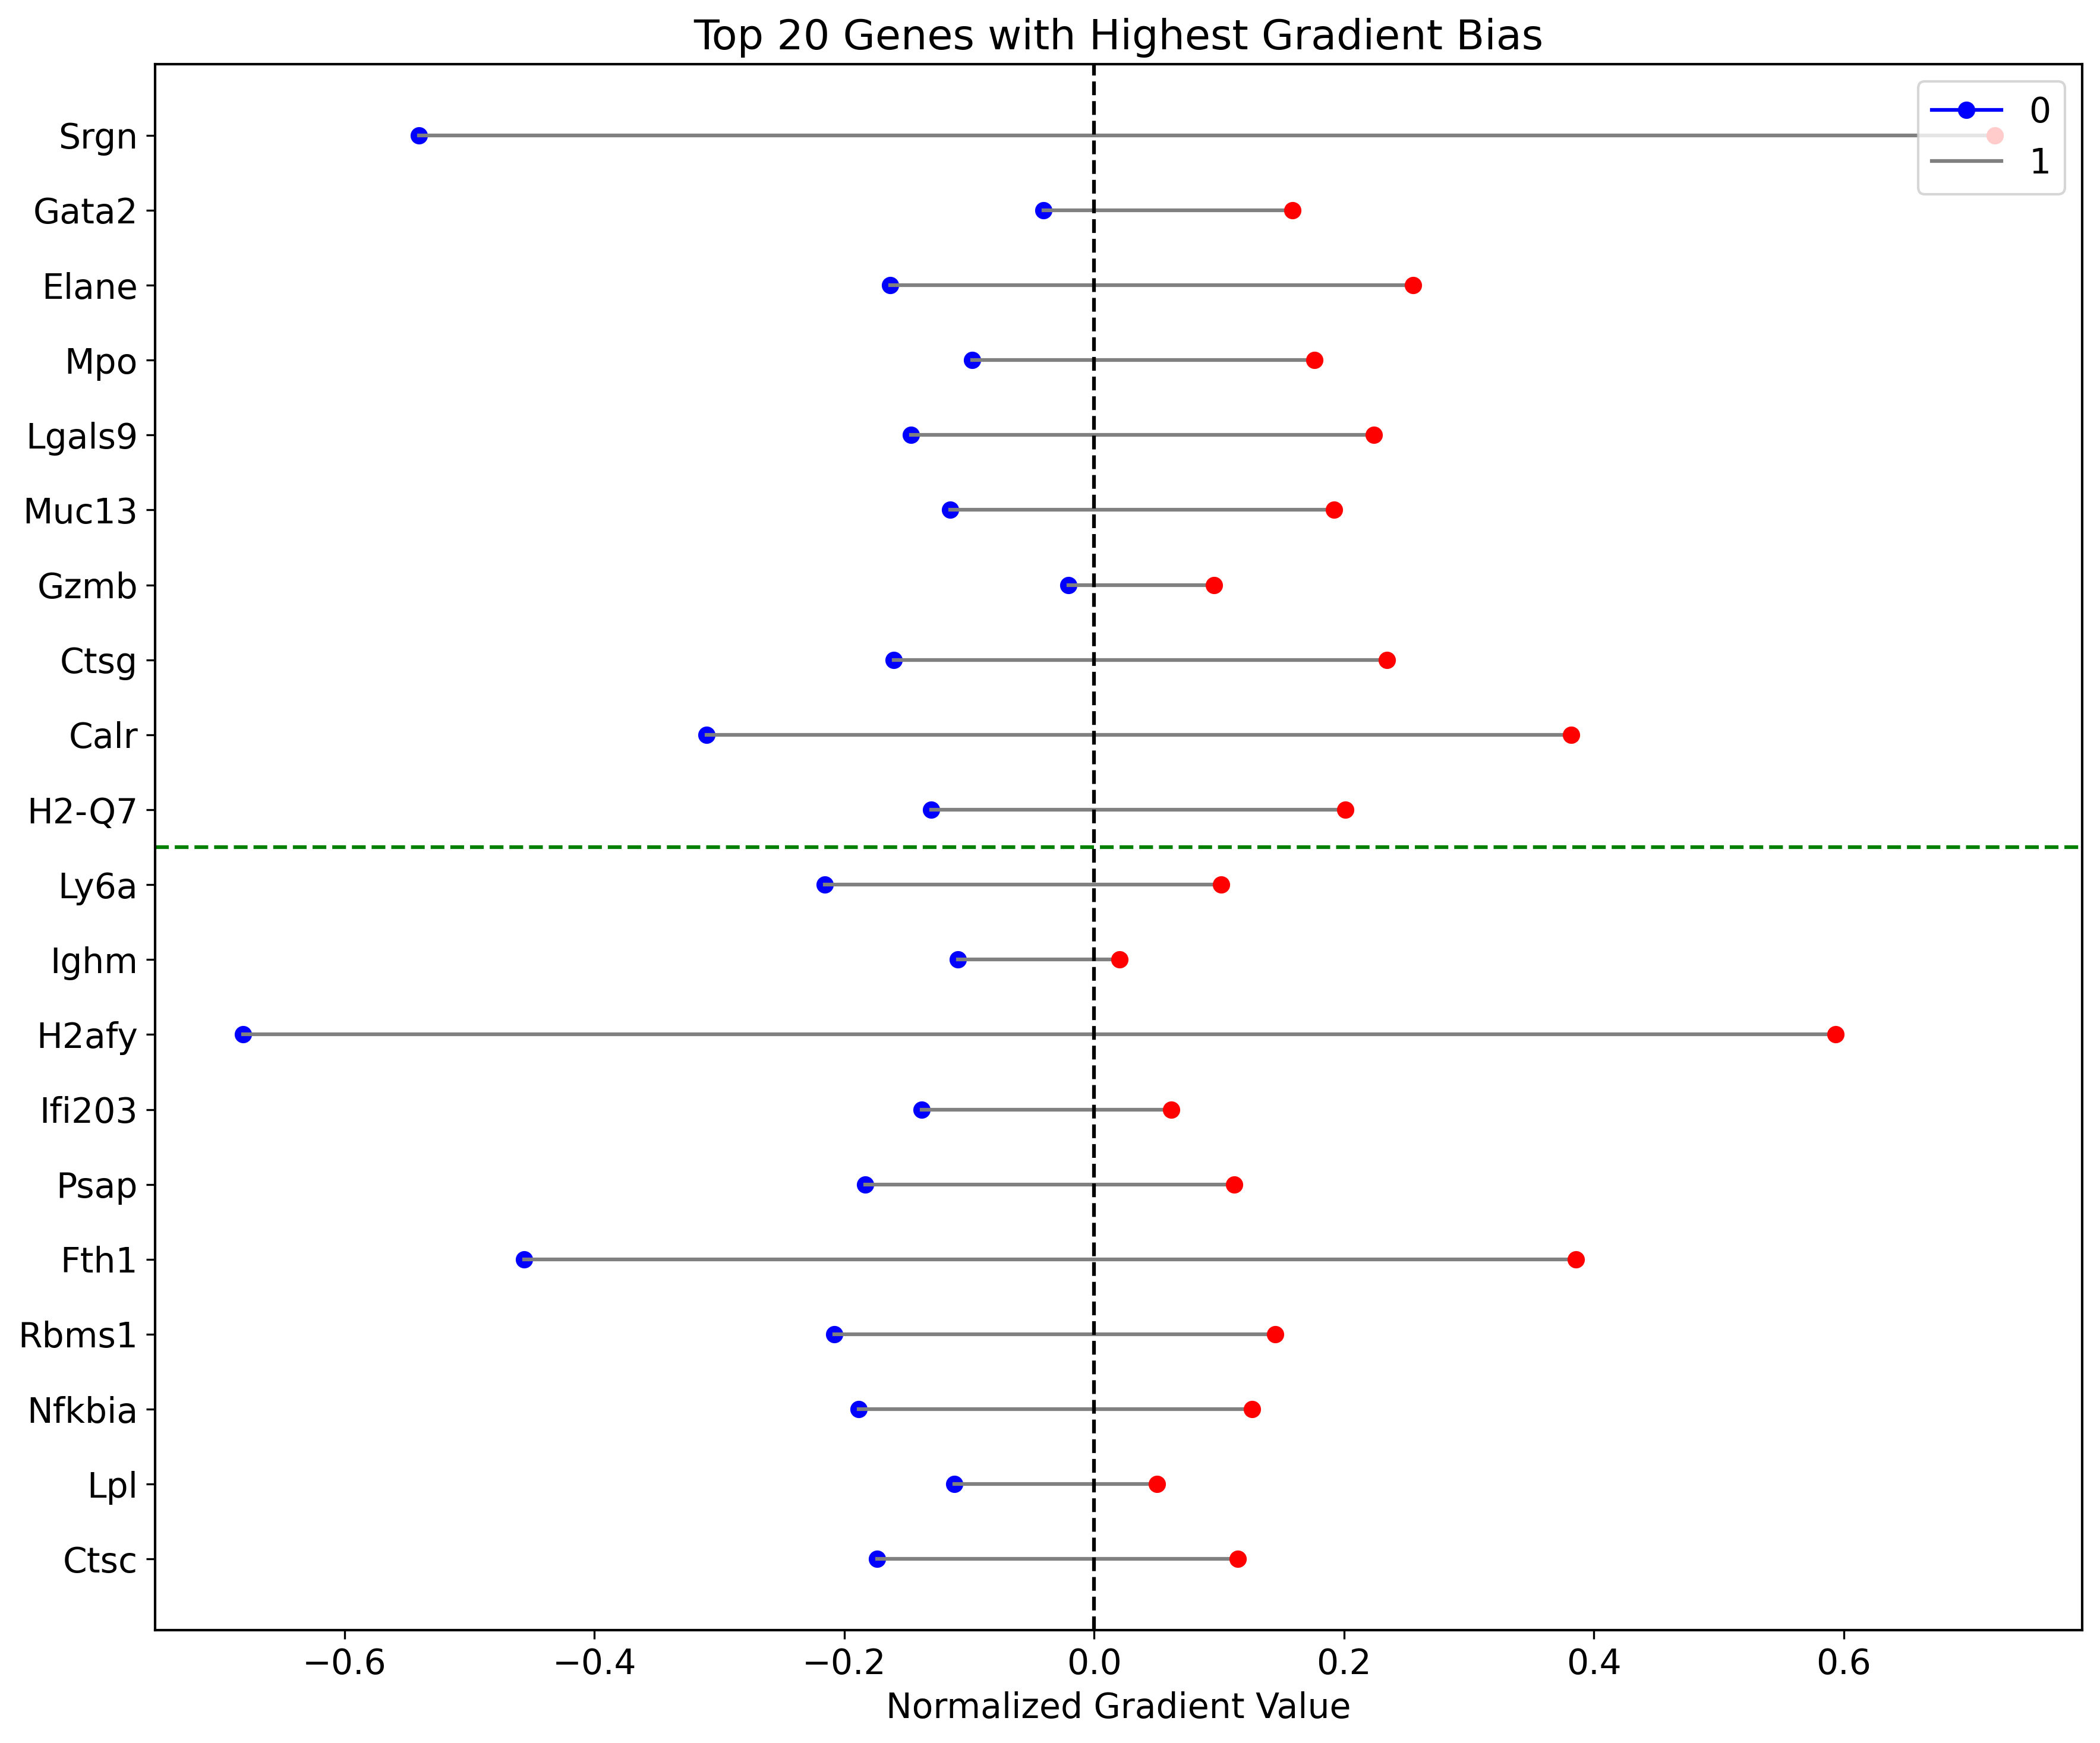
top_genes_bias
[76]:
| 0 | 1 | diff | bias | |
|---|---|---|---|---|
| Ctsc | -0.173801 | 0.115267 | 0.058534 | -0.058534 |
| Lpl | -0.111949 | 0.050364 | 0.061585 | -0.061585 |
| Nfkbia | -0.188631 | 0.126453 | 0.062178 | -0.062178 |
| Rbms1 | -0.207719 | 0.145031 | 0.062688 | -0.062688 |
| Fth1 | -0.456394 | 0.385800 | 0.070594 | -0.070594 |
| Psap | -0.183319 | 0.112002 | 0.071317 | -0.071317 |
| Ifi203 | -0.138005 | 0.061555 | 0.076451 | -0.076451 |
| H2afy | -0.681413 | 0.593418 | 0.087995 | -0.087995 |
| Ighm | -0.109224 | 0.020179 | 0.089045 | -0.089045 |
| Ly6a | -0.215512 | 0.101576 | 0.113935 | -0.113935 |
| H2-Q7 | -0.130340 | 0.200920 | -0.070580 | 0.070580 |
| Calr | -0.310392 | 0.382003 | -0.071612 | 0.071612 |
| Ctsg | -0.160164 | 0.234527 | -0.074363 | 0.074363 |
| Gzmb | -0.020378 | 0.096122 | -0.075744 | 0.075744 |
| Muc13 | -0.115342 | 0.191869 | -0.076527 | 0.076527 |
| Lgals9 | -0.146582 | 0.223989 | -0.077408 | 0.077408 |
| Mpo | -0.097797 | 0.176222 | -0.078425 | 0.078425 |
| Elane | -0.163360 | 0.255346 | -0.091986 | 0.091986 |
| Gata2 | -0.040284 | 0.158828 | -0.118543 | 0.118543 |
| Srgn | -0.540197 | 0.720850 | -0.180652 | 0.180652 |
[35]:
import matplotlib.pyplot as plt
df_gradients_all_normalized = df_gradients_all.copy()
# for label in labels:
#     df_gradients_all_normalized[label] = (df_gradients_all[label] - df_gradients_all[label].min()) / (df_gradients_all[label].max() - df_gradients_all[label].min())


df_gradients_all_normalized[labels[0]] = -df_gradients_all_normalized[labels[0]]

df_gradients_all_normalized['bias'] = df_gradients_all_normalized[labels[1]] + df_gradients_all_normalized[labels[0]]

sorted_df_right_bias = df_gradients_all_normalized.sort_values(by='bias', ascending=False).head(10)
sorted_df_right_bias =sorted_df_right_bias.sort_values(by='bias', ascending=True)

sorted_df_left_bias = df_gradients_all_normalized.sort_values(by='bias').head(10)
sorted_df_left_bias =sorted_df_left_bias.sort_values(by='bias', ascending=False)
top_genes_bias = pd.concat([sorted_df_left_bias, sorted_df_right_bias])
#top_genes_bias = top_genes_bias.sort_values(by='bias', key=abs, ascending=False)

fig, ax = plt.subplots(figsize=(12, 10))


colors = ['blue', 'red']

for gene in top_genes_bias.index:
    for i, label in enumerate(labels):
        x_value = top_genes_bias.loc[gene, label]
        y_value = list(top_genes_bias.index).index(gene)
        ax.plot(x_value, y_value, marker='o', color=colors[i])
        if i == 0:
            x_values = [top_genes_bias.loc[gene, labels[0]], top_genes_bias.loc[gene, labels[1]]]
            y_values = [y_value, y_value]
            ax.plot(x_values, y_values, linestyle='-', color='grey')

ax.axvline(0, color='black', linestyle='--')

divider_position = 10
ax.axhline(divider_position - 0.5, color='green', linestyle='--')

ax.set_yticks(range(len(top_genes_bias.index)))
ax.set_yticklabels(top_genes_bias.index)
ax.set_title('Top 20 Genes with Highest Gradient Bias')
ax.set_xlabel('Normalized Gradient Value')
ax.legend(labels, loc='upper right')

plt.tight_layout()
plt.show()
fig.savefig("/home/zhengtuo/songtao/weinreb_lolipop_plot.pdf", dpi=1000)
[66]:
top_genes_bias1 = top_genes_bias.sort_values(by='bias', key=abs, ascending=False)
top_genes_bias1.index
[66]:
Index(['Srgn', 'Elane', 'Mpo', 'Ctsg', 'Gstm1', 'Ly6a', 'Calr', 'Prtn3',
       'Fth1', 'H2-Q7', 'Gfi1', 'Ap3s1', 'Ifi203', 'Cybb', 'Spp1', 'Lpl',
       'Psap', 'Ctsc', 'Rbms1', '2810417H13Rik'],
      dtype='object')
[71]:
top_genes_bias1 = top_genes_bias.sort_values(by='bias', key=abs, ascending=False)
top_genes_bias1.index
[71]:
Index(['Srgn', 'Gata2', 'Ly6a', 'Elane', 'Ighm', 'H2afy', 'Mpo', 'Lgals9',
       'Muc13', 'Ifi203', 'Gzmb', 'Ctsg', 'Calr', 'Psap', 'Fth1', 'H2-Q7',
       'Rbms1', 'Nfkbia', 'Lpl', 'Ctsc'],
      dtype='object')
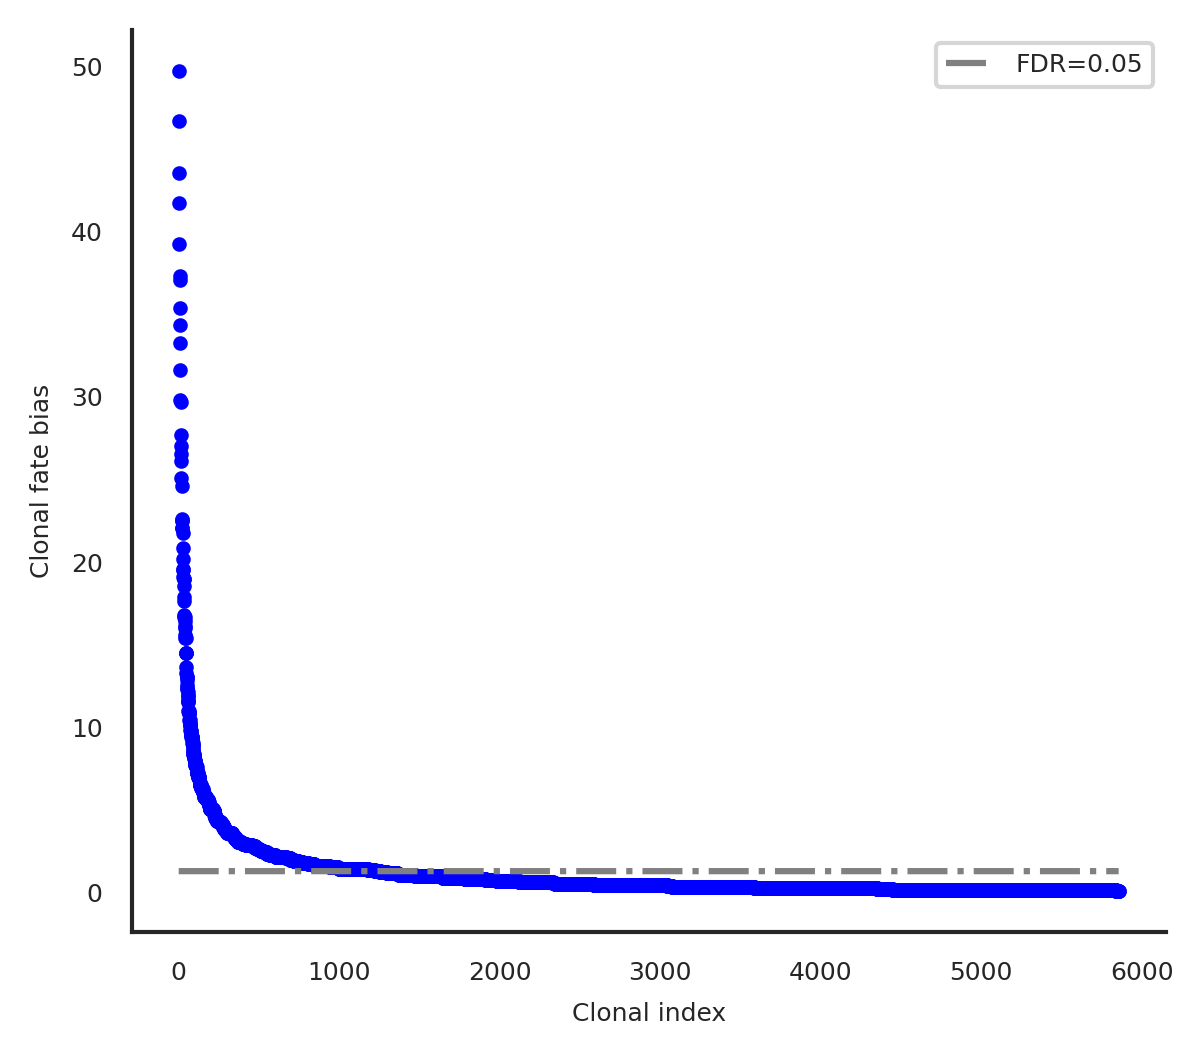
[881]:
cs.tl.clonal_fate_bias(
    adata, selected_fate="Neutrophil", alternative="two-sided"
)
cs.pl.clonal_fate_bias(adata)
100%|██████████████████████████████████████| 5864/5864 [00:41<00:00, 140.11it/s]
Data saved at adata.uns['clonal_fate_bias']
[347]:
from matplotlib.colors import LinearSegmentedColormap
colors = [(1, 0, 0), (1, 1, 1), (0, 0, 1)]  # R -> W -> B
n_bins = 100
cmap_name = 'custom_div_cmap'
cm = LinearSegmentedColormap.from_list(cmap_name, colors, N=n_bins)
[77]:
import anndata
# df_expression_all['diff'] = df_expression_all[labels[0]] - df_expression_all[labels[1]]
adata.obs['fate_pred']=adata.obs['fate_pred'].astype('category')
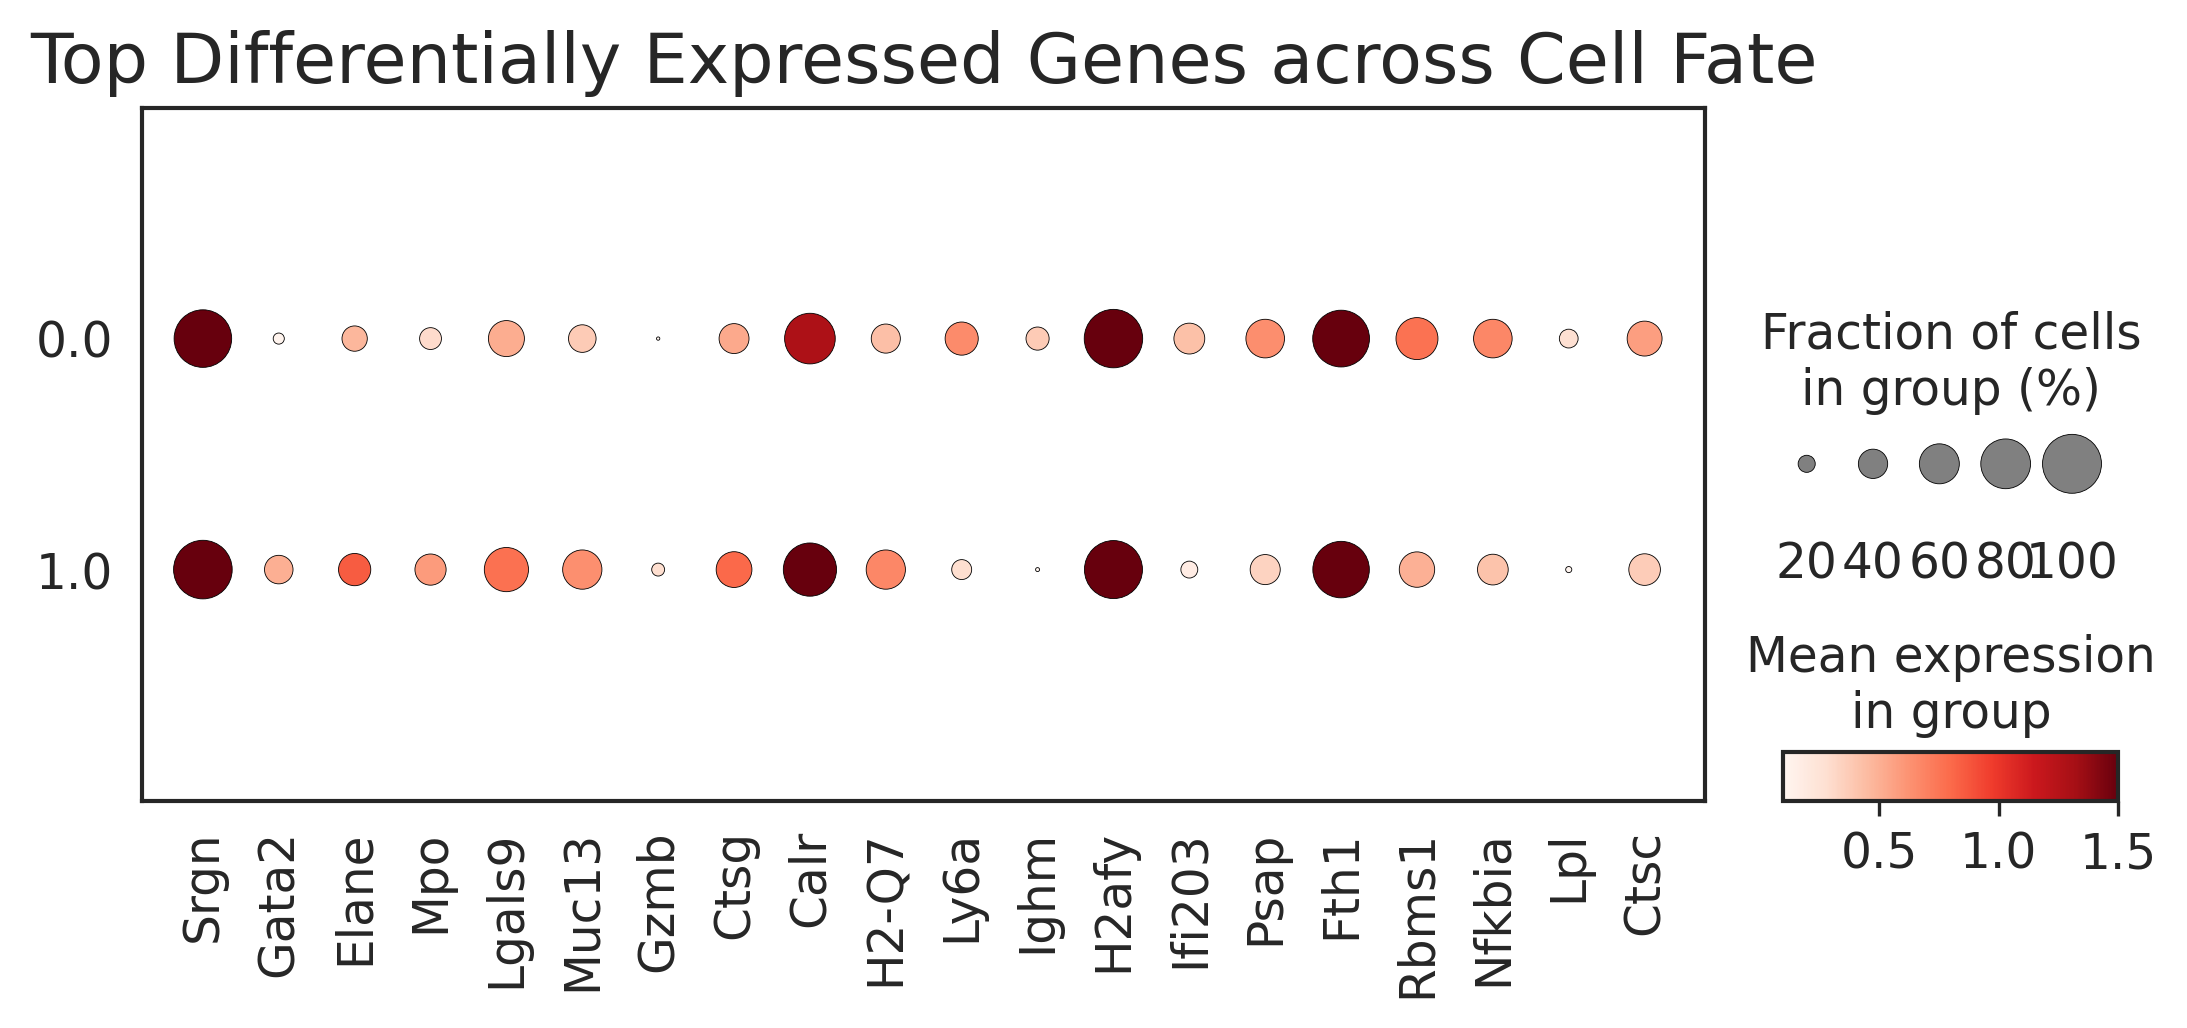
top_genes = top_genes_bias[::-1].index
adata_raw = anndata.AnnData(X=adata.raw.X, var=adata.raw.var, obs=adata.obs)
sc.pl.dotplot(adata_raw,
var_names=top_genes,
groupby='fate_pred',
figsize=(8.5, 3),
dot_max=1,
dot_min=0.01,
color_map='Reds',
title="Top Differentially Expressed Genes across Cell Fate",
vmin=0.1,
vmax=1.5,
save='weinreb_dotplot.pdf')
WARNING: saving figure to file figures/dotplot_weinreb_dotplot.pdf
/home/zhengtuo/miniconda3/lib/python3.9/site-packages/scanpy/plotting/_dotplot.py:749: UserWarning: No data for colormapping provided via 'c'. Parameters 'cmap', 'norm' will be ignored
  dot_ax.scatter(x, y, **kwds)
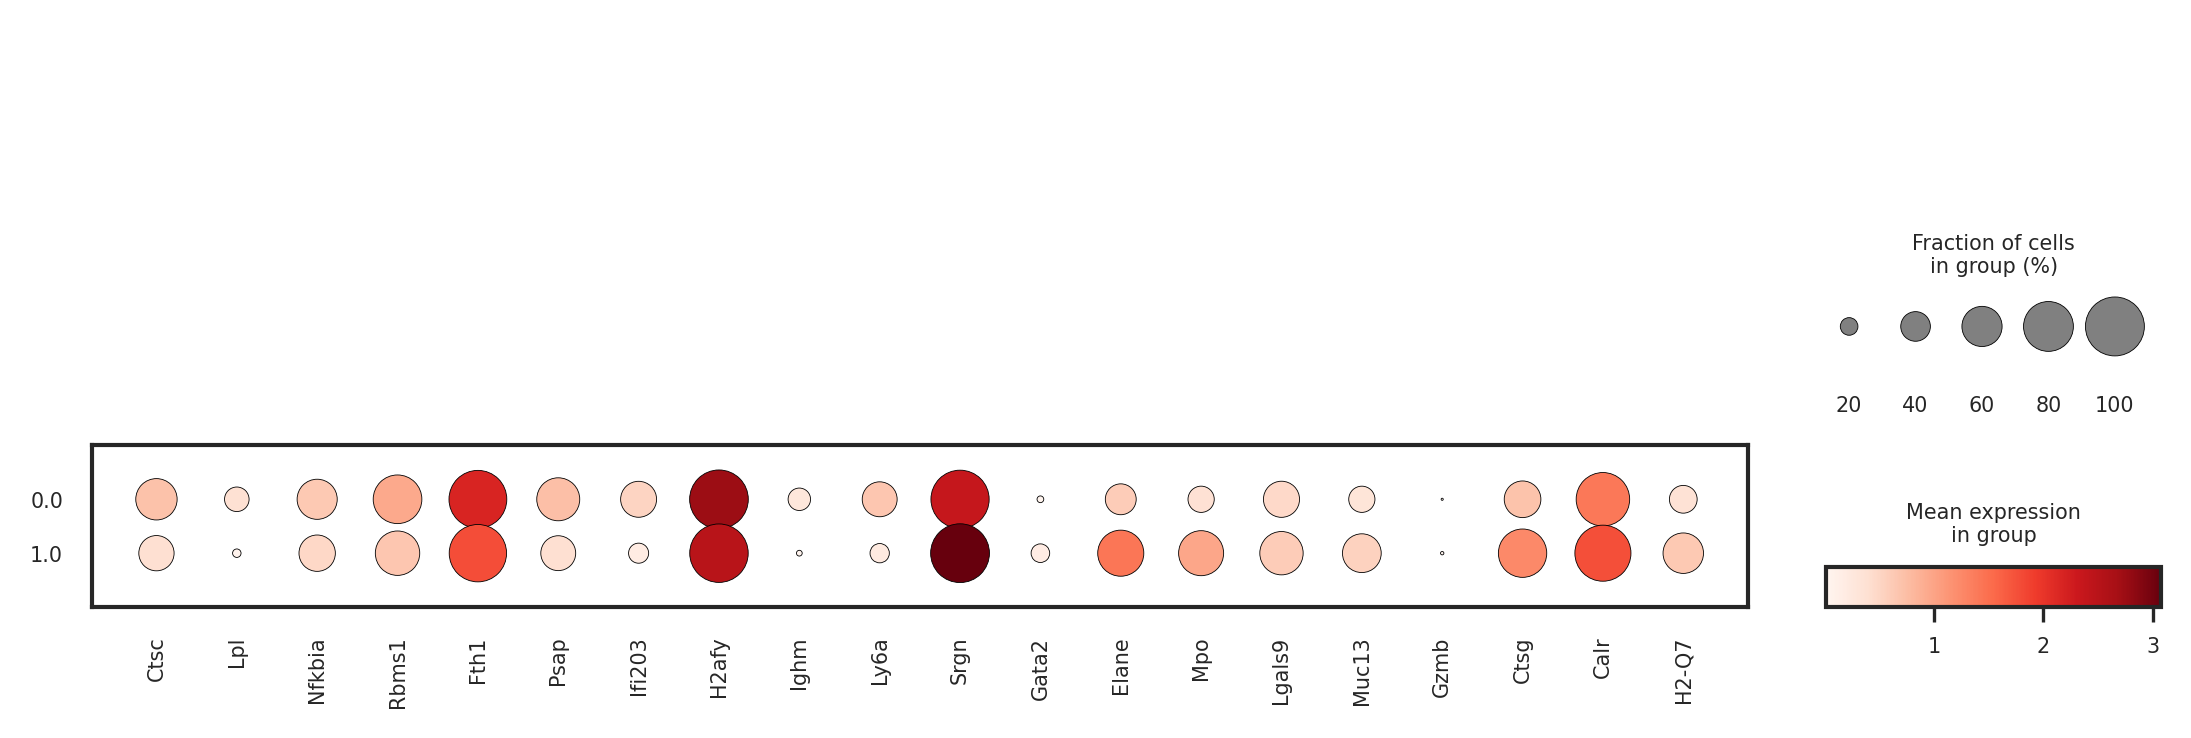
[501]:
sc.pl.dotplot(adata_raw,
            var_names=top_genes,
              groupby='fate_pred',

            )
/home/zhengtuo/miniconda3/lib/python3.9/site-packages/scanpy/plotting/_dotplot.py:749: UserWarning: No data for colormapping provided via 'c'. Parameters 'cmap', 'norm' will be ignored
  dot_ax.scatter(x, y, **kwds)
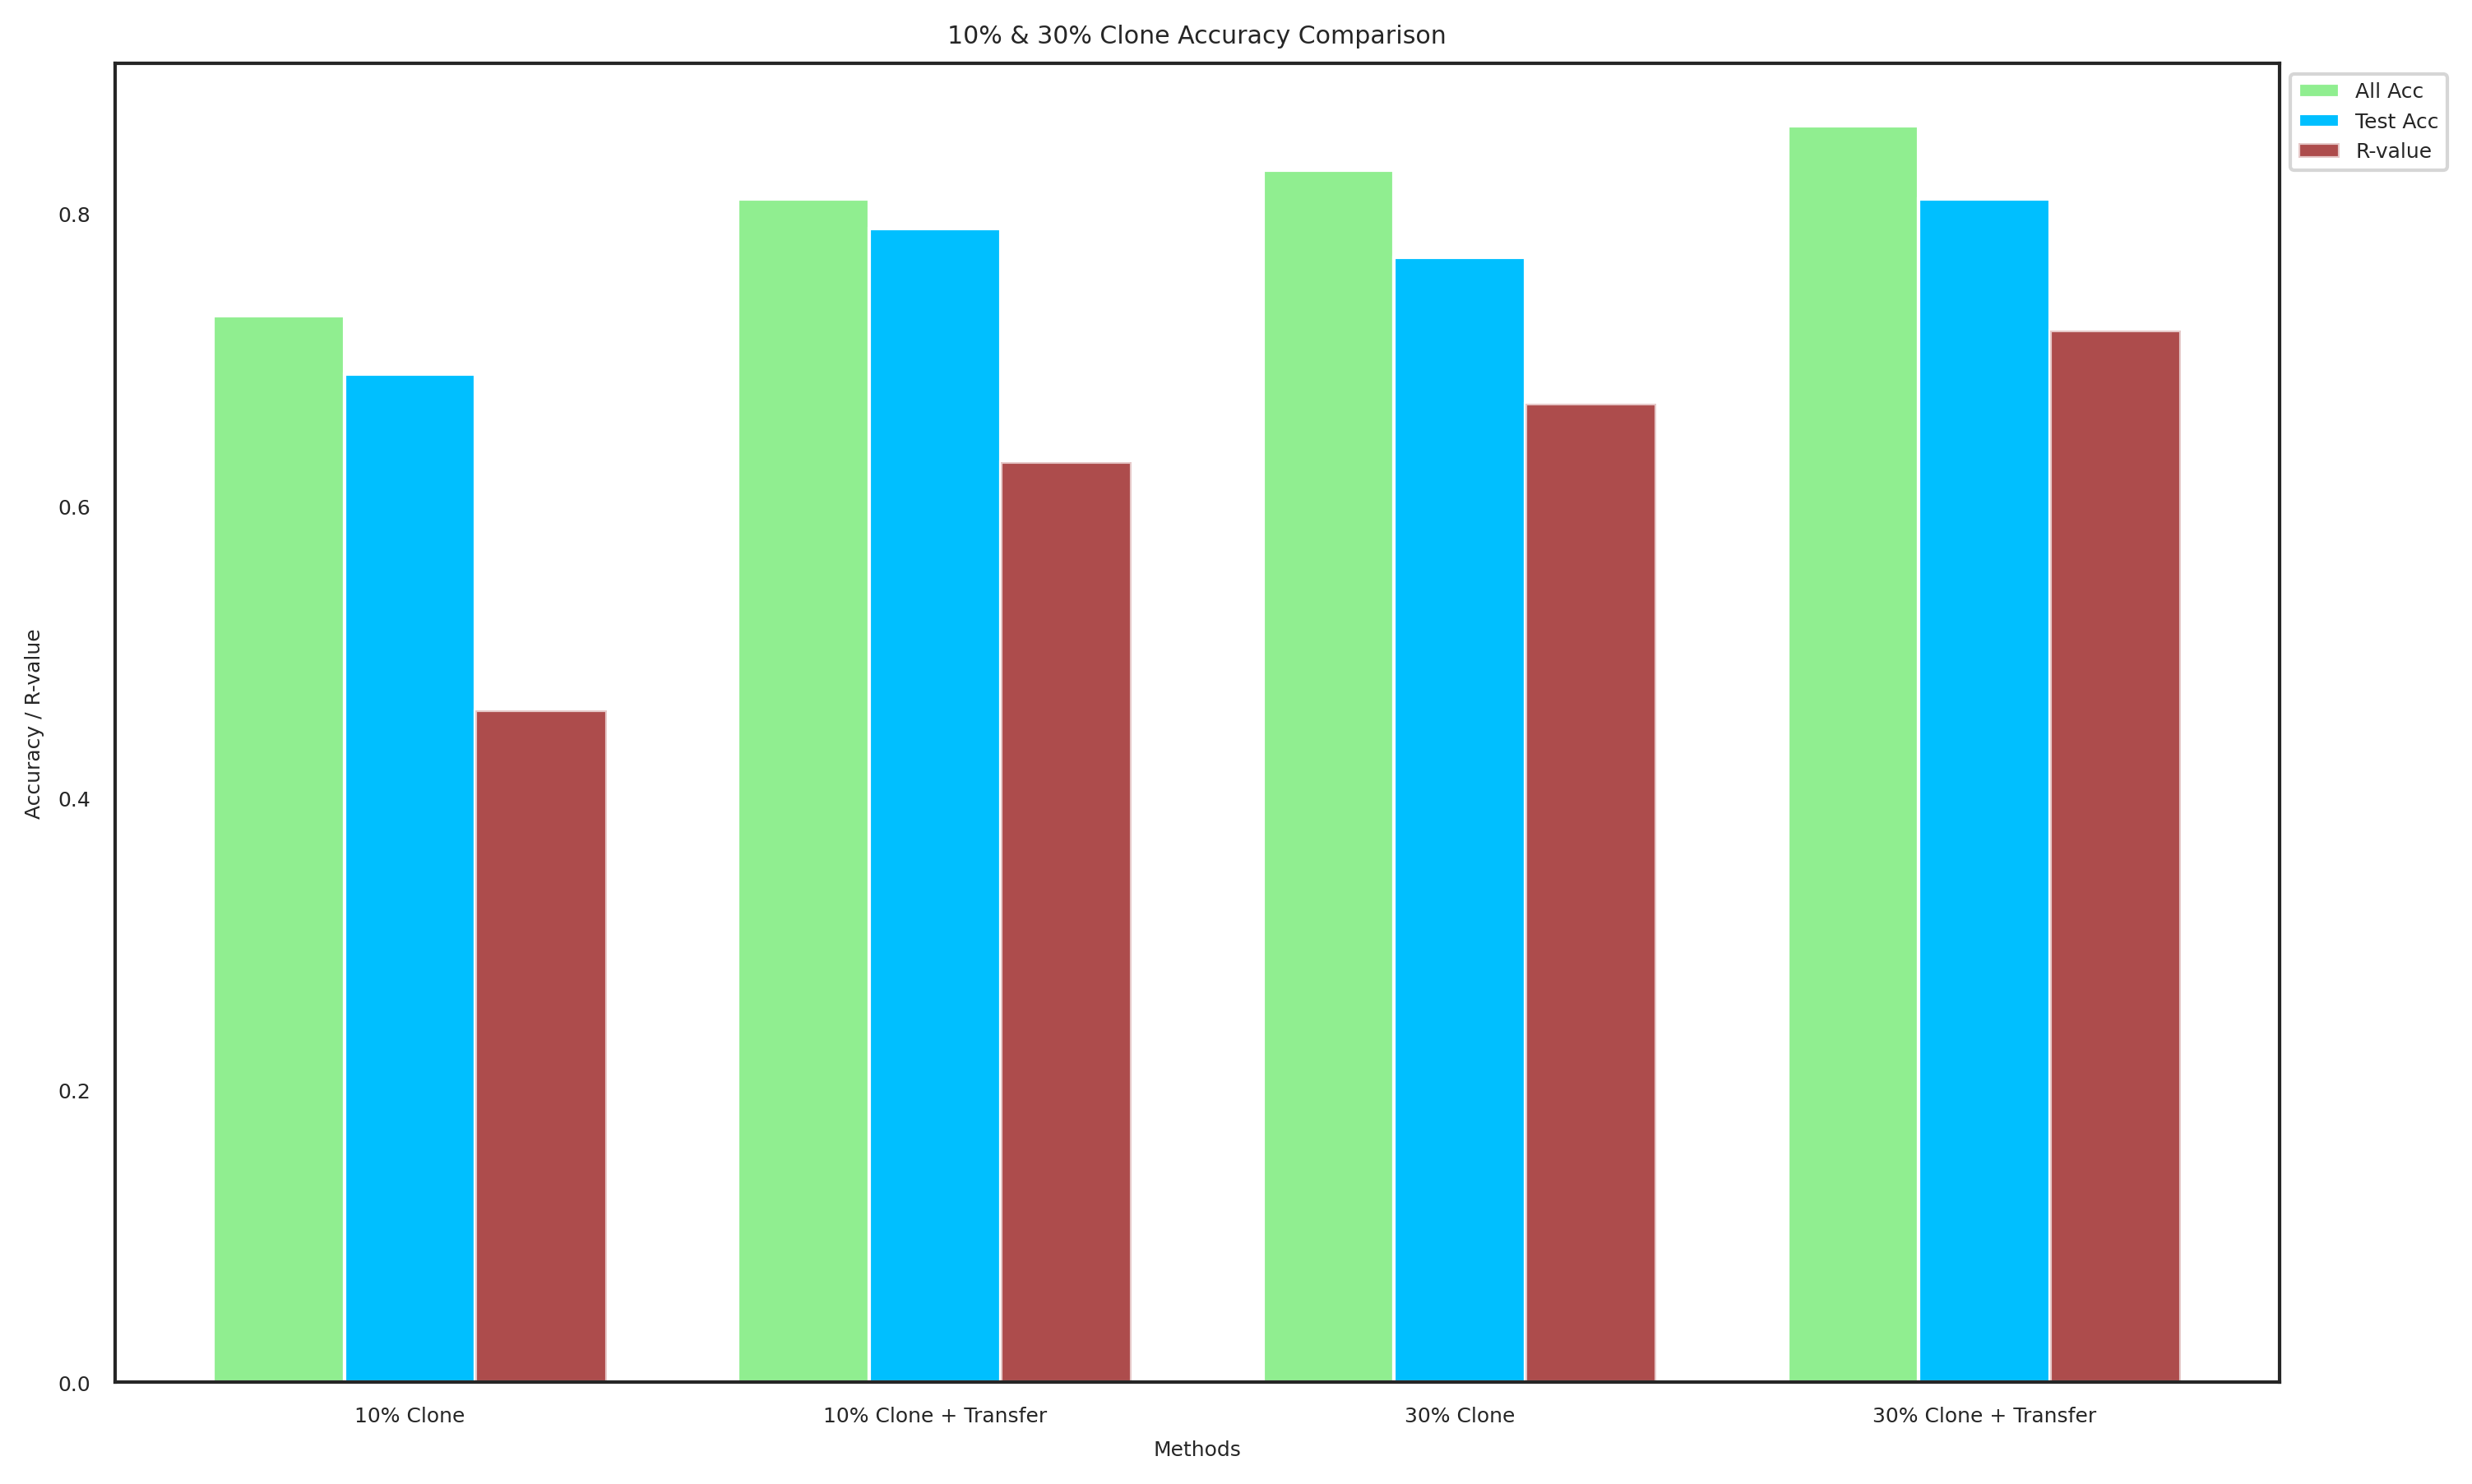
[140]:
import matplotlib.pyplot as plt
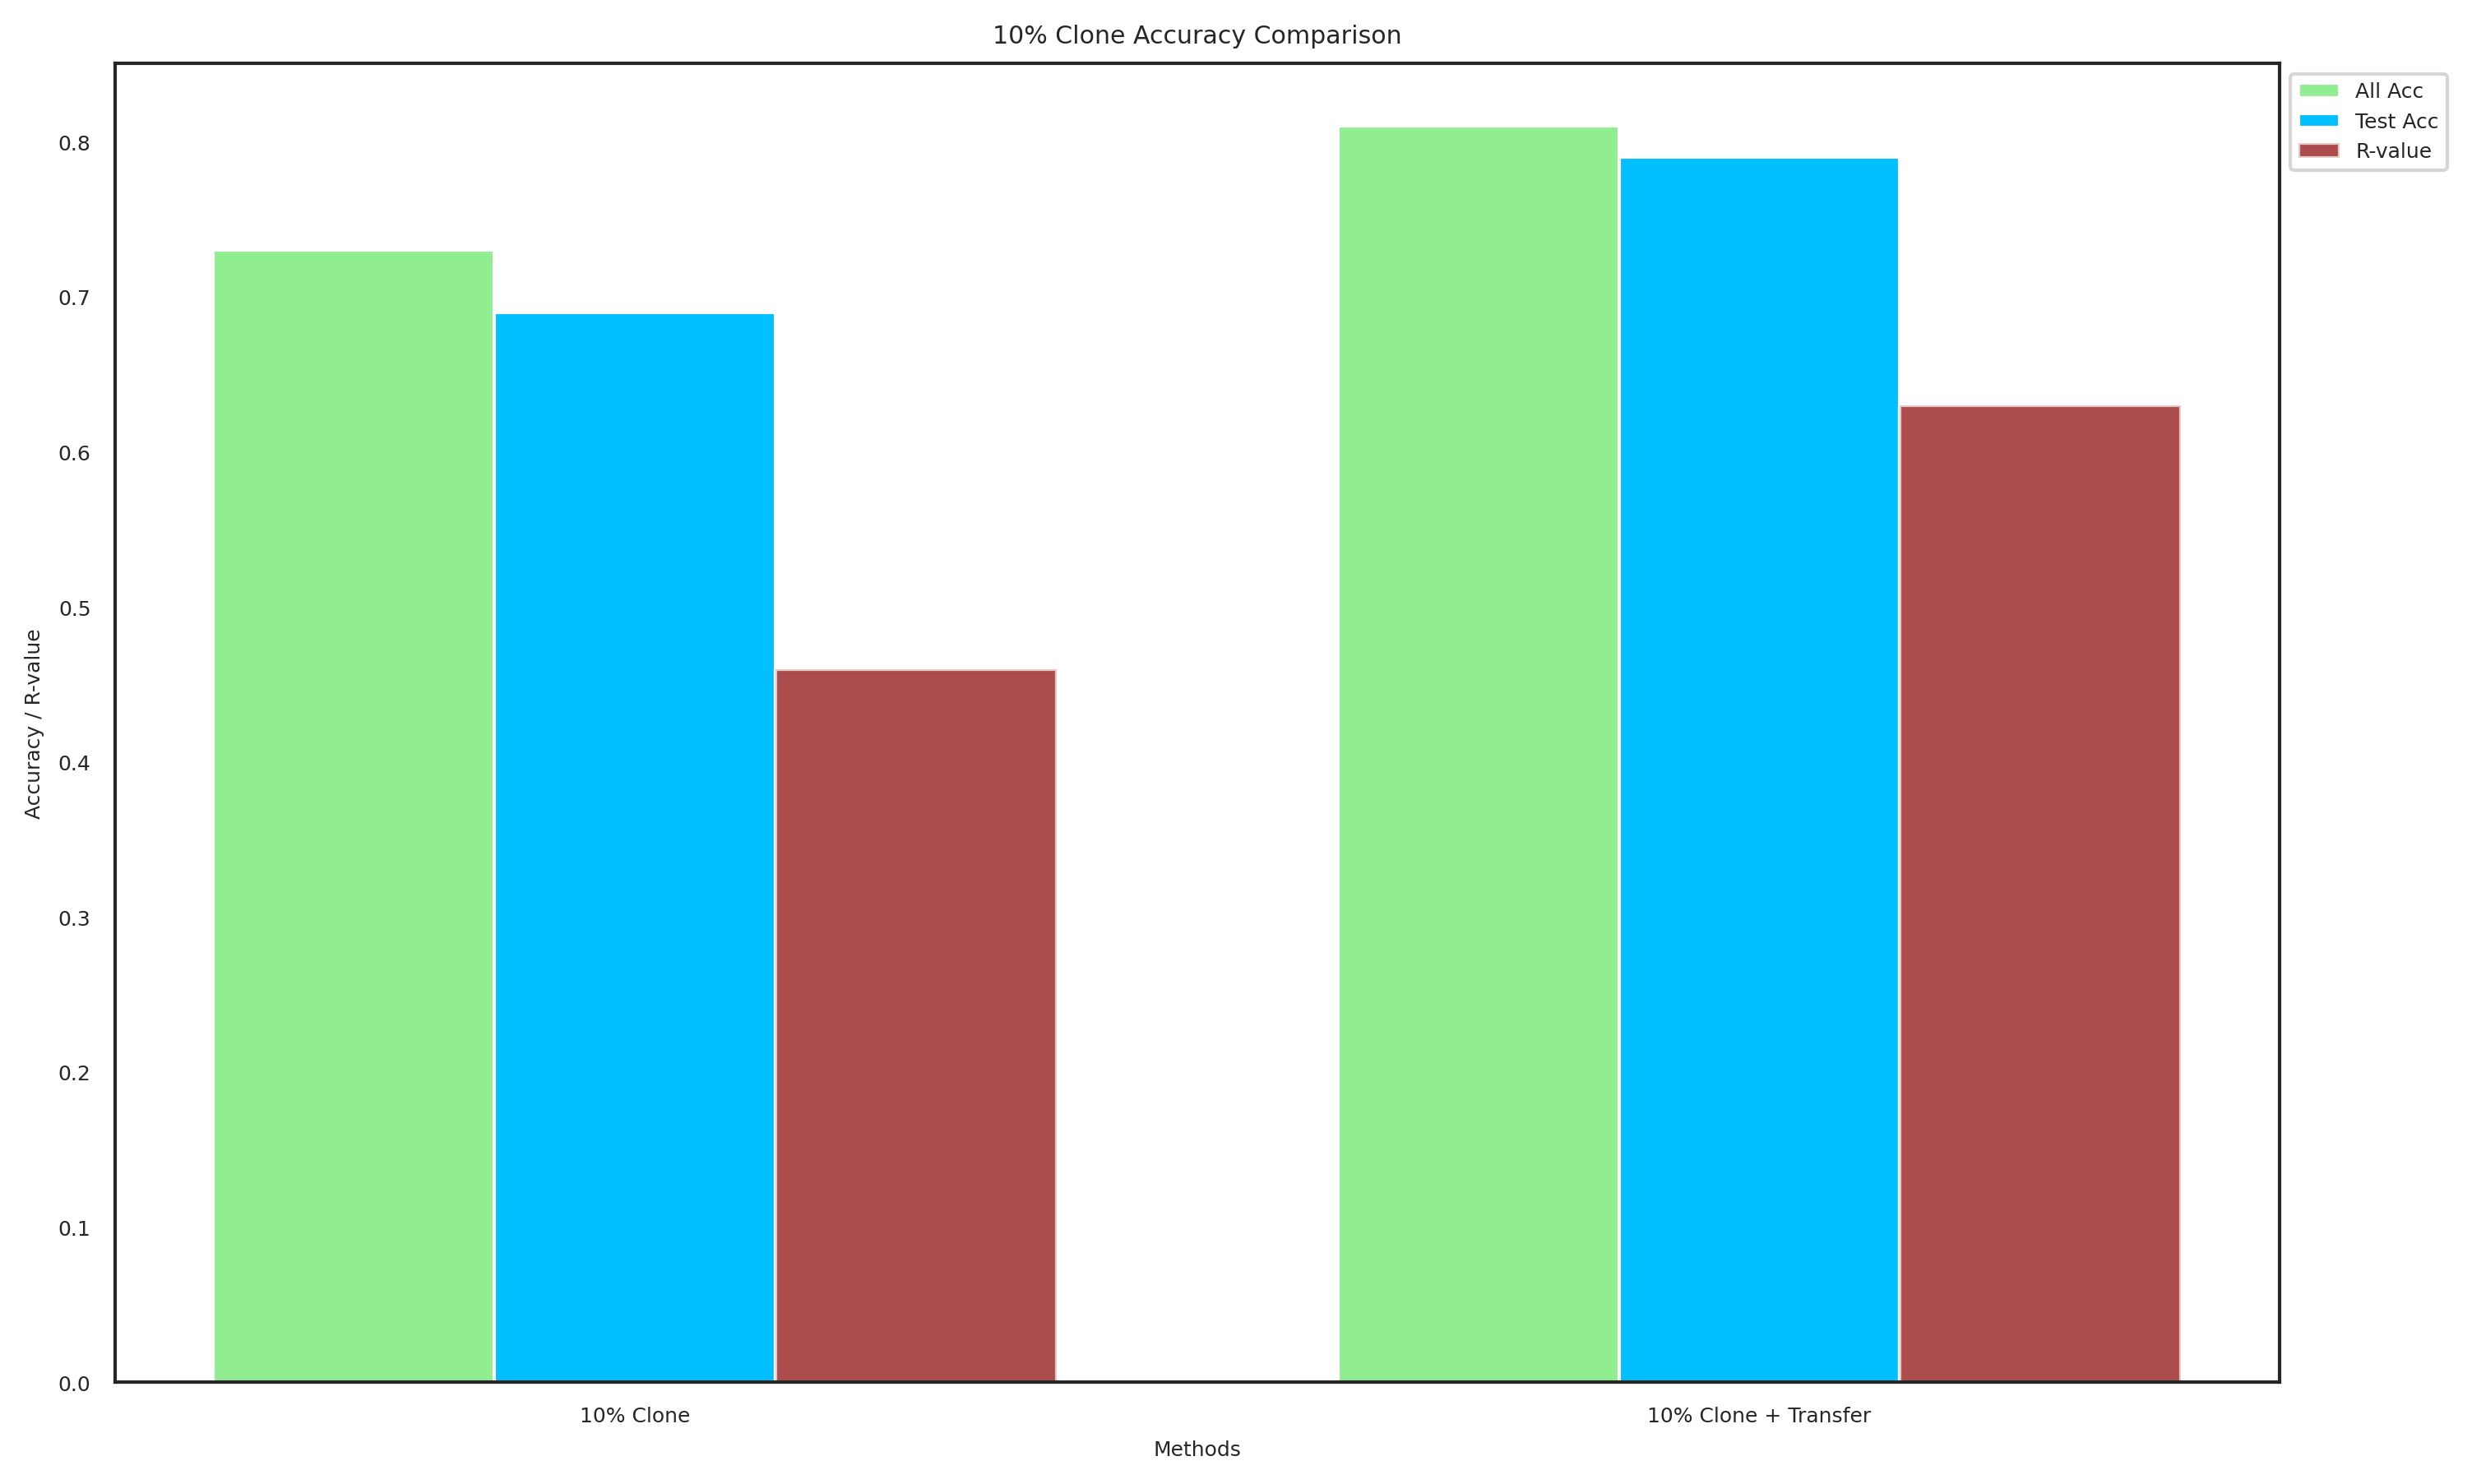
methods_10 = ["10% Clone", "10% Clone + Transfer"]
all_acc_10 = [0.73, 0.81]
test_acc_10 = [0.69, 0.79]
R_values_10 = [0.46, 0.63]
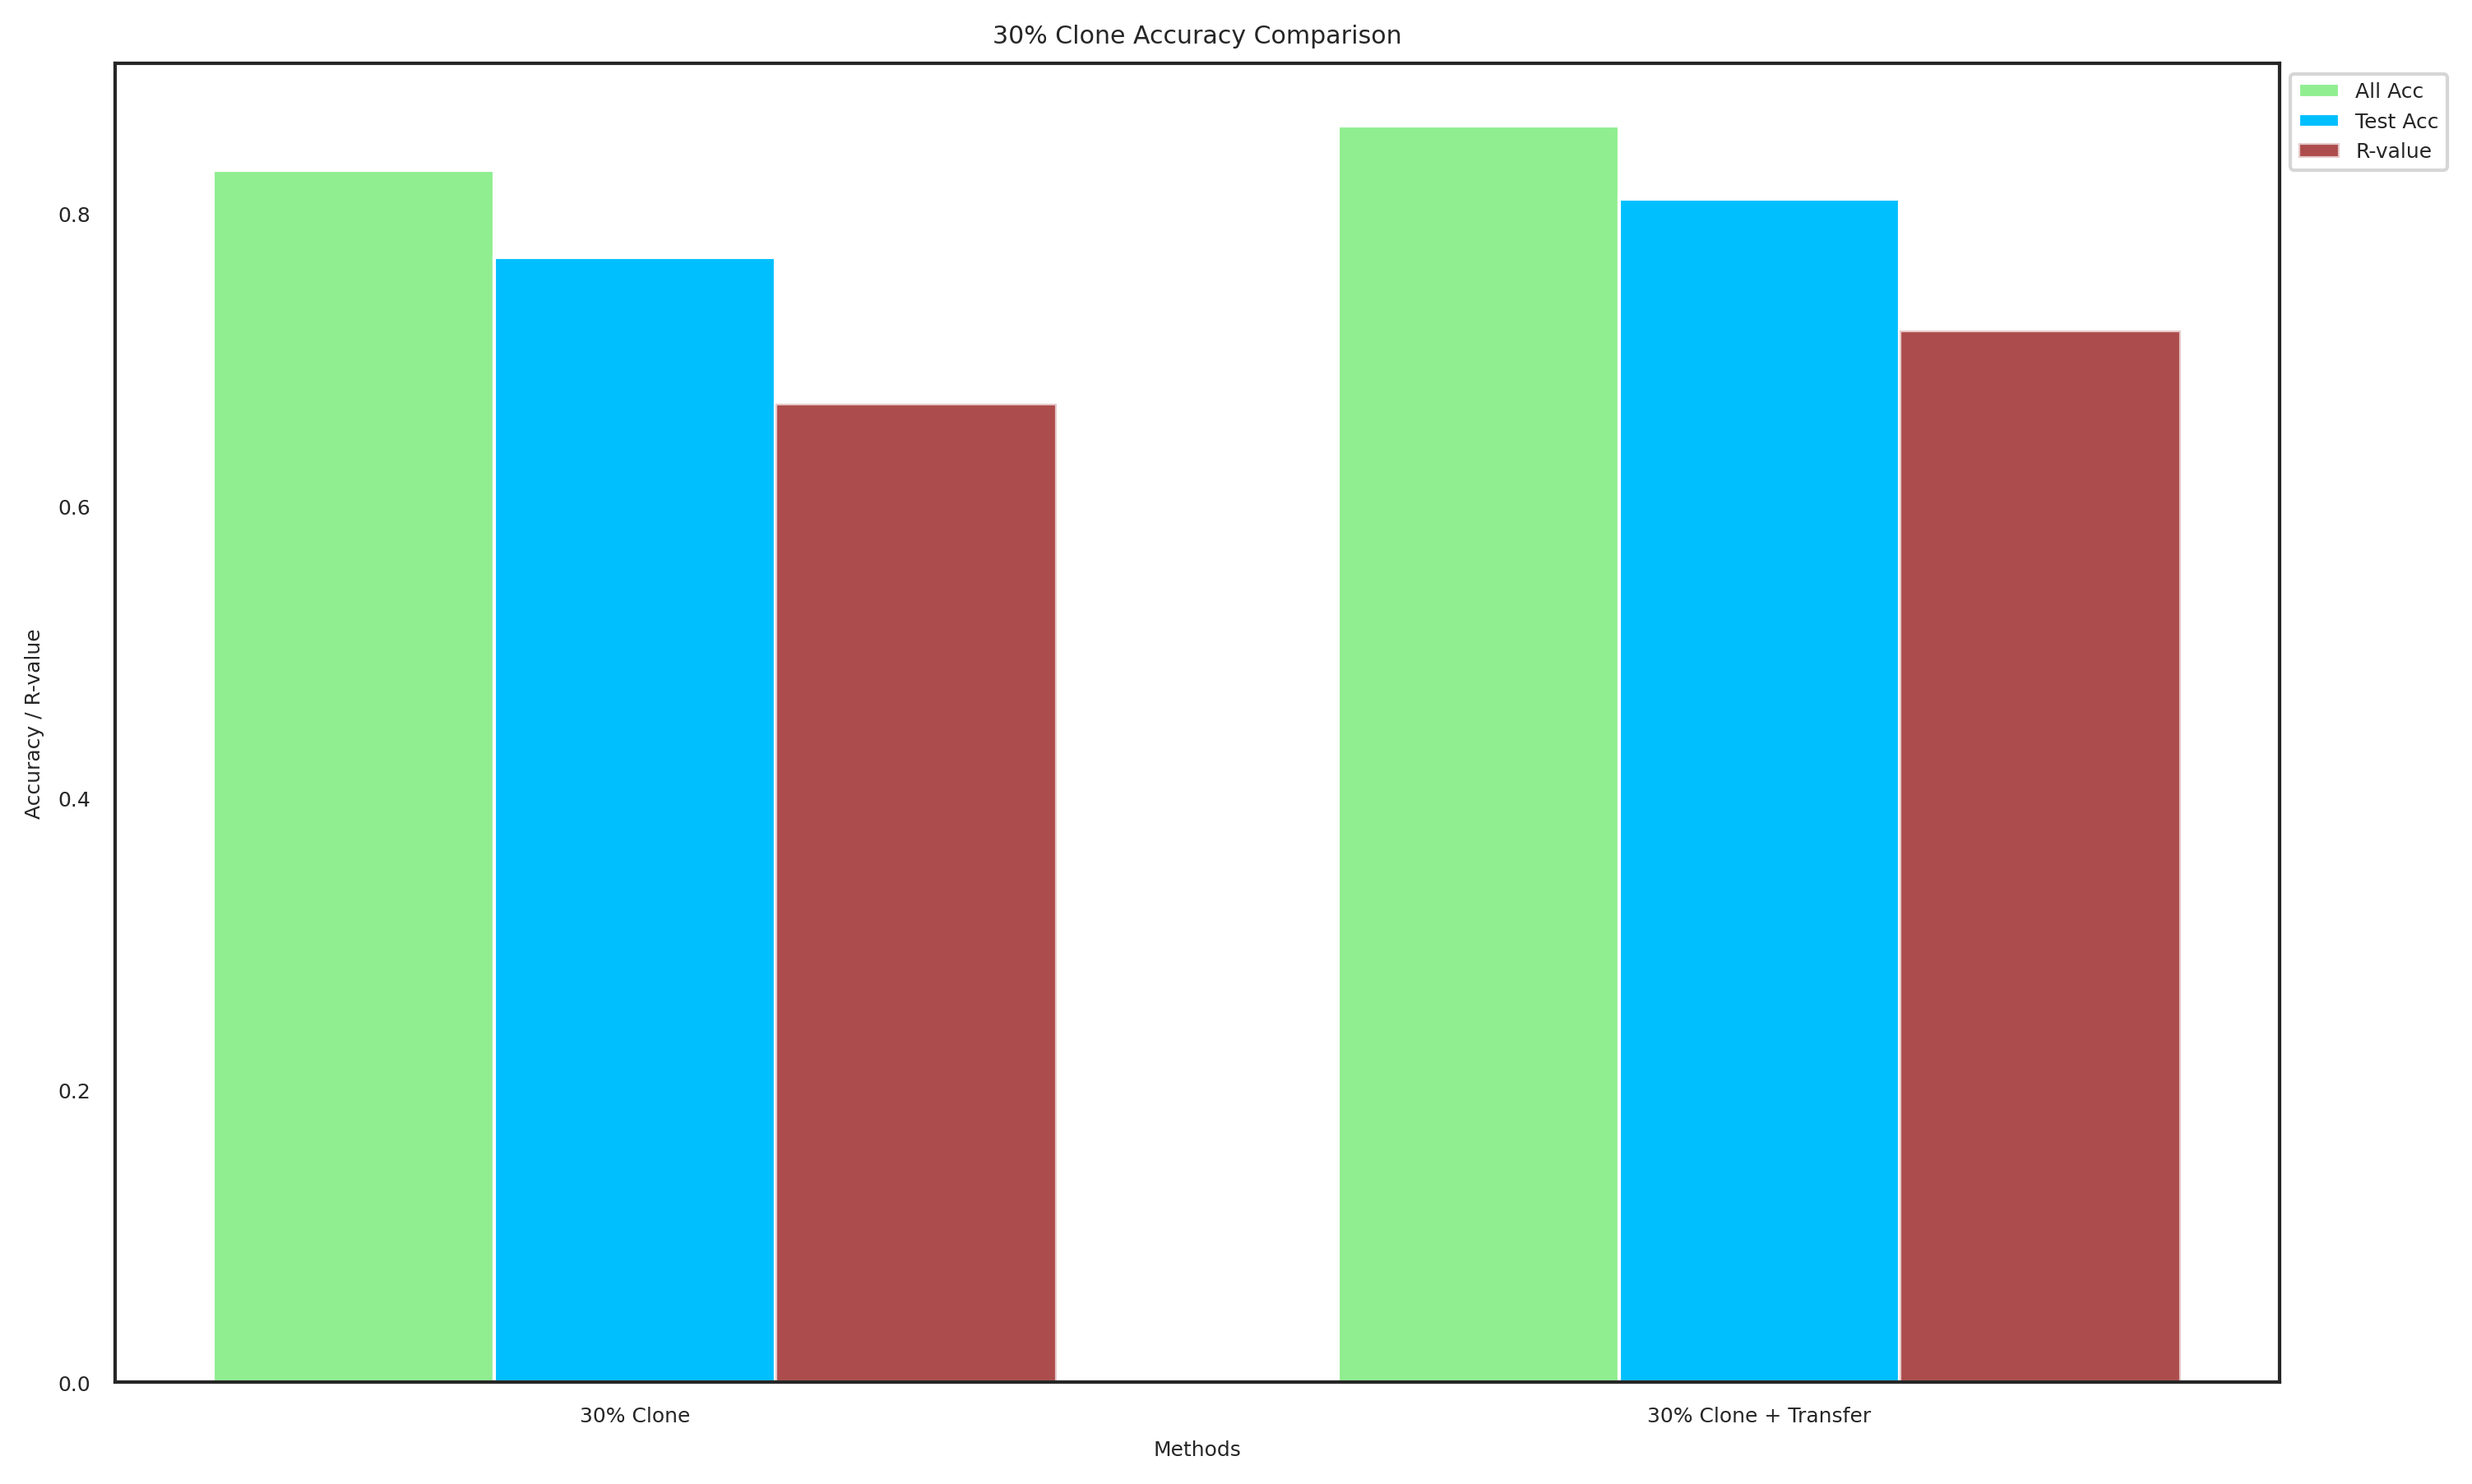
methods_30 = ["30% Clone", "30% Clone + Transfer"]
all_acc_30 = [0.83, 0.86]
test_acc_30 = [0.77, 0.81]
R_values_30 = [0.67, 0.72]
methods_combined = methods_10 + methods_30
all_acc_combined = all_acc_10 + all_acc_30
test_acc_combined = test_acc_10 + test_acc_30
R_values_combined = R_values_10 + R_values_30
bar_width = 0.25
colors = ['deepskyblue', 'lightgreen', 'darkred']
# ... [rest of the code remains unchanged]
def plot_data(methods, all_acc, test_acc, R_values, title, filename):
fig, ax = plt.subplots(figsize=(10, 6))
index = range(len(methods))
bar1 = ax.bar(index, all_acc, bar_width, label='All Acc', color=colors[1])
bar2 = ax.bar([i+bar_width for i in index], test_acc, bar_width, label='Test Acc', color=colors[0])
bar3 = ax.bar([i+2*bar_width for i in index], R_values, bar_width, label='R-value', color=colors[2], alpha=0.7)
ax.set_title(title)
ax.set_xlabel('Methods')
ax.set_ylabel('Accuracy / R-value')
ax.set_xticks([i + bar_width for i in index])
ax.set_xticklabels(methods)
ax.legend(loc='upper left', bbox_to_anchor=(1, 1))
plt.tight_layout()
plt.savefig(filename, dpi=1000)
plot_data(methods_10, all_acc_10, test_acc_10, R_values_10, "10% Clone Accuracy Comparison", "10_clone_accuracy.pdf")
plot_data(methods_30, all_acc_30, test_acc_30, R_values_30, "30% Clone Accuracy Comparison", "30_clone_accuracy.pdf")
plot_data(methods_combined, all_acc_combined, test_acc_combined, R_values_combined, "10% & 30% Clone Accuracy Comparison", "combined_clone_accuracy.pdf")
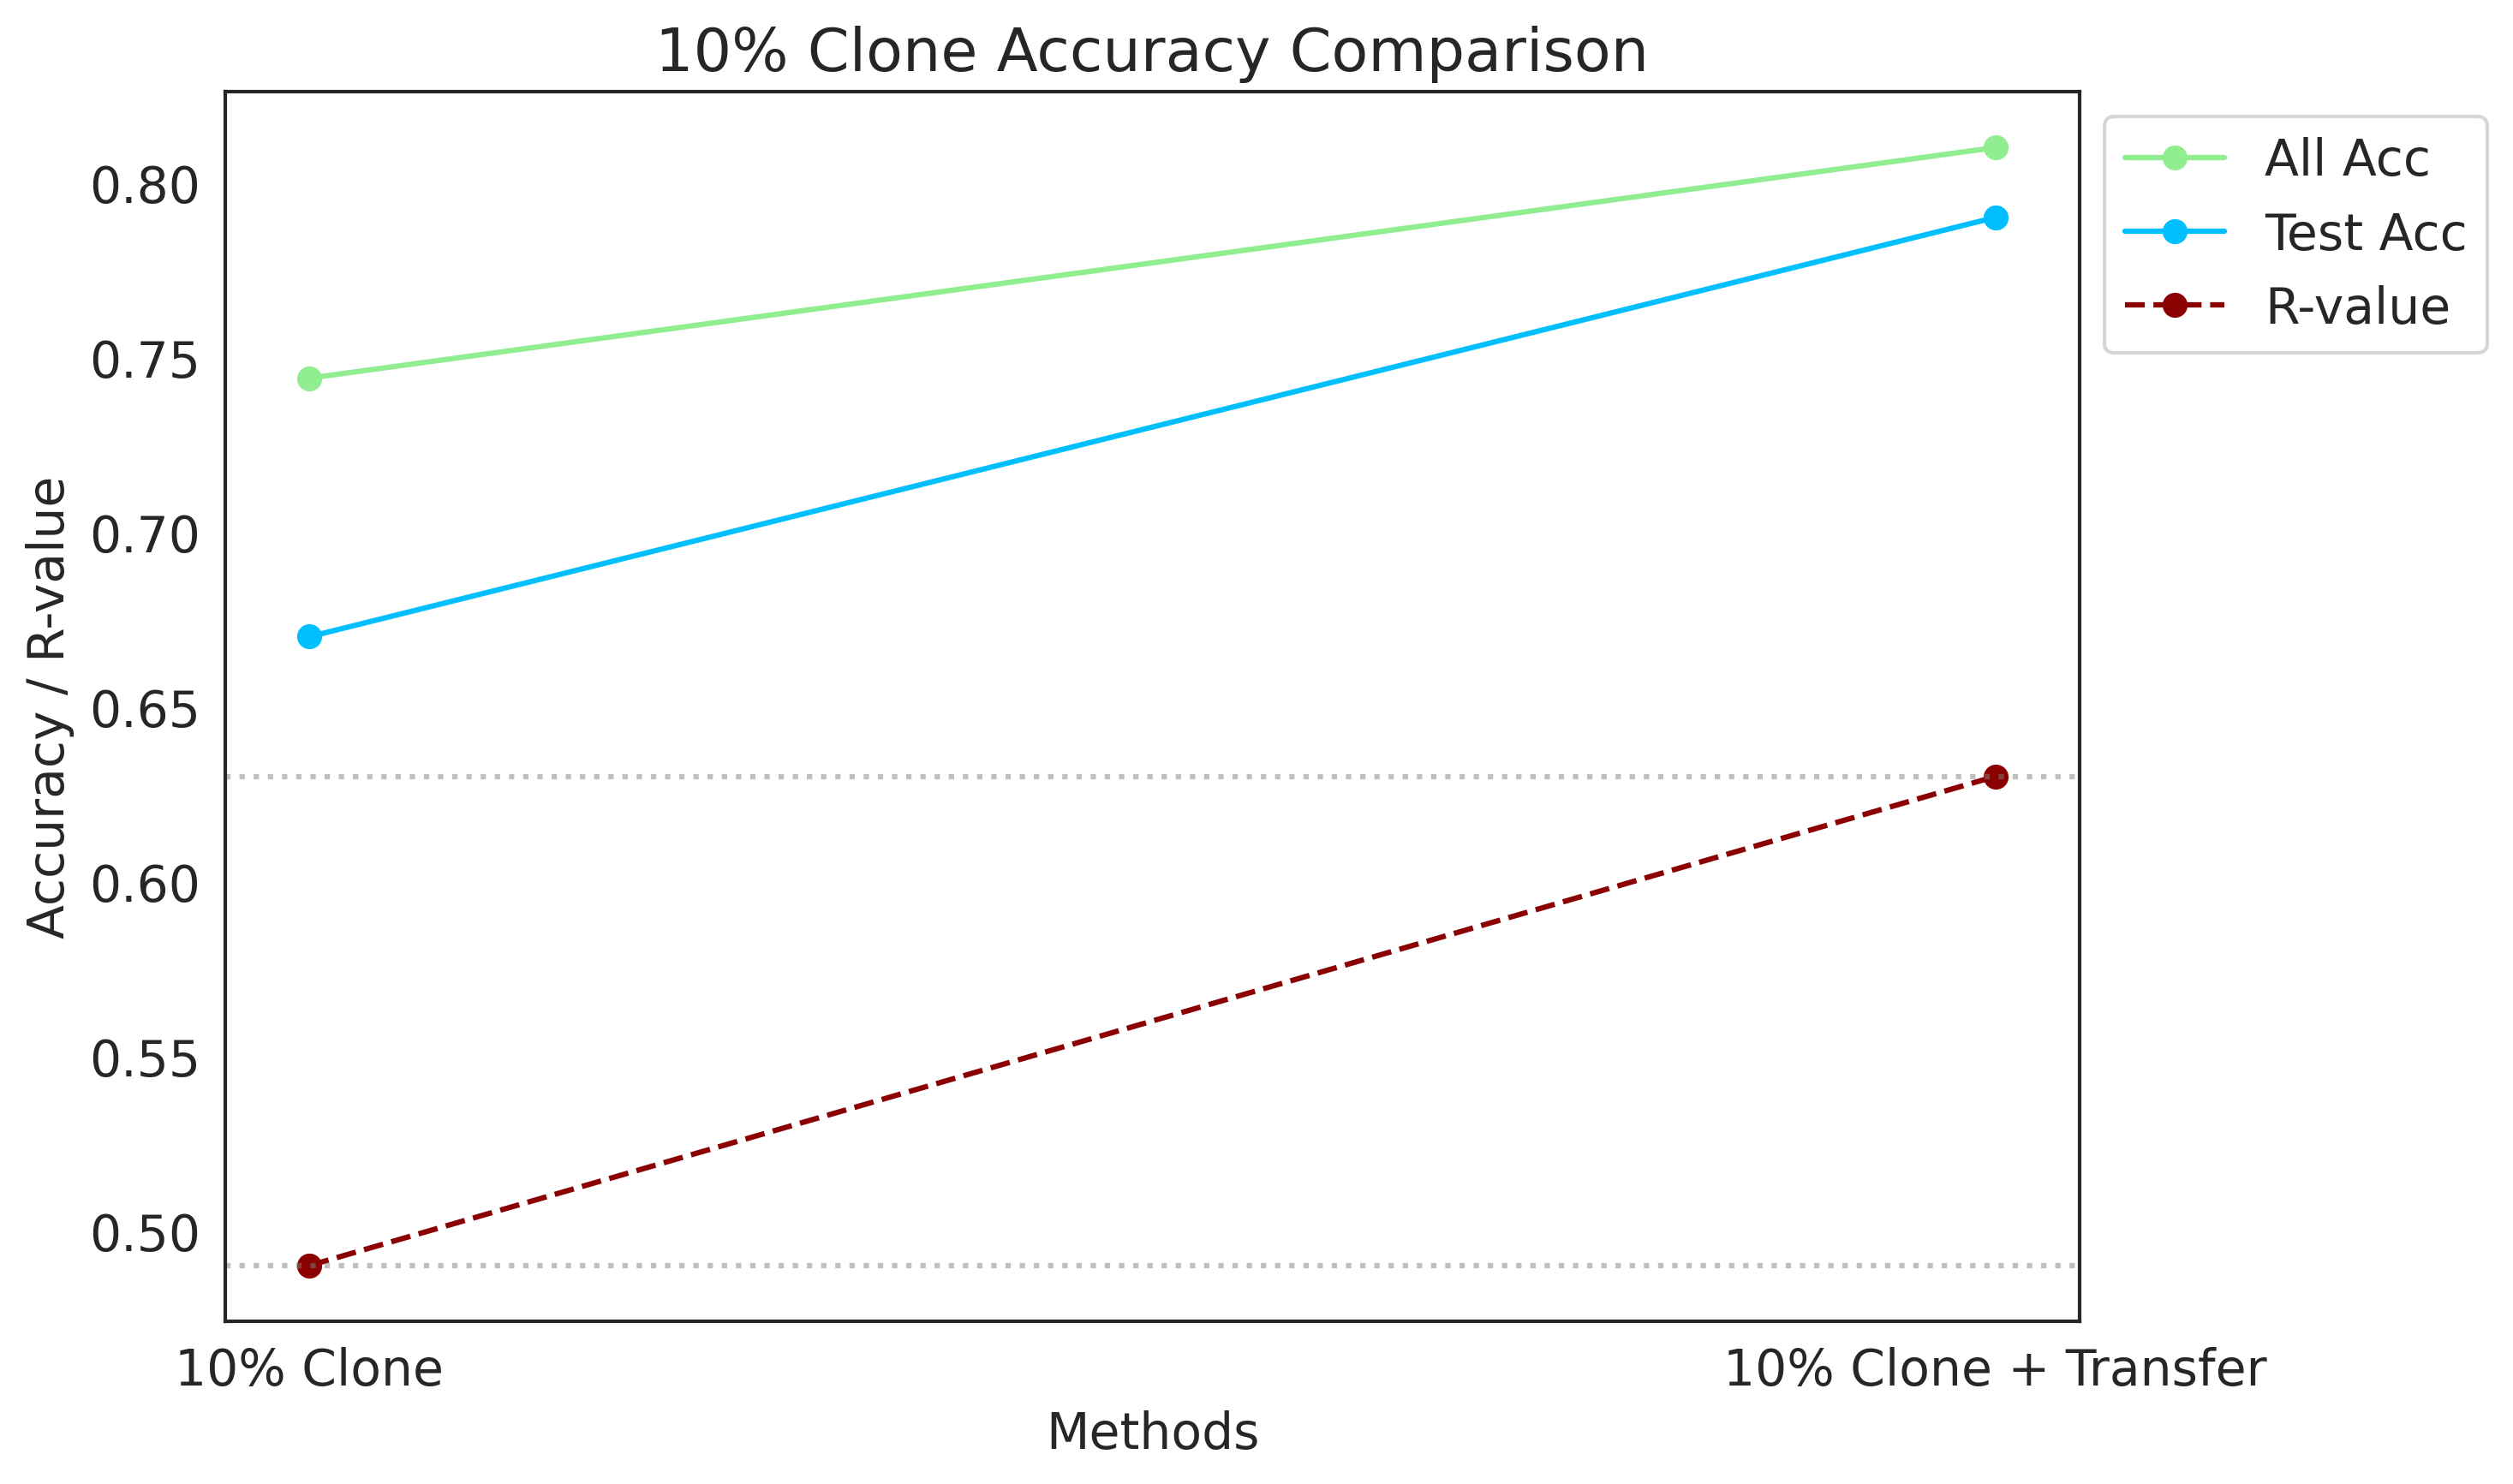
[116]:
import matplotlib.pyplot as plt
methods_10 = ["10% Clone", "10% Clone + Transfer"]
all_acc_10 = [0.744, 0.81]
test_acc_10 = [0.67, 0.79]
R_values_10 = [0.49, 0.63]
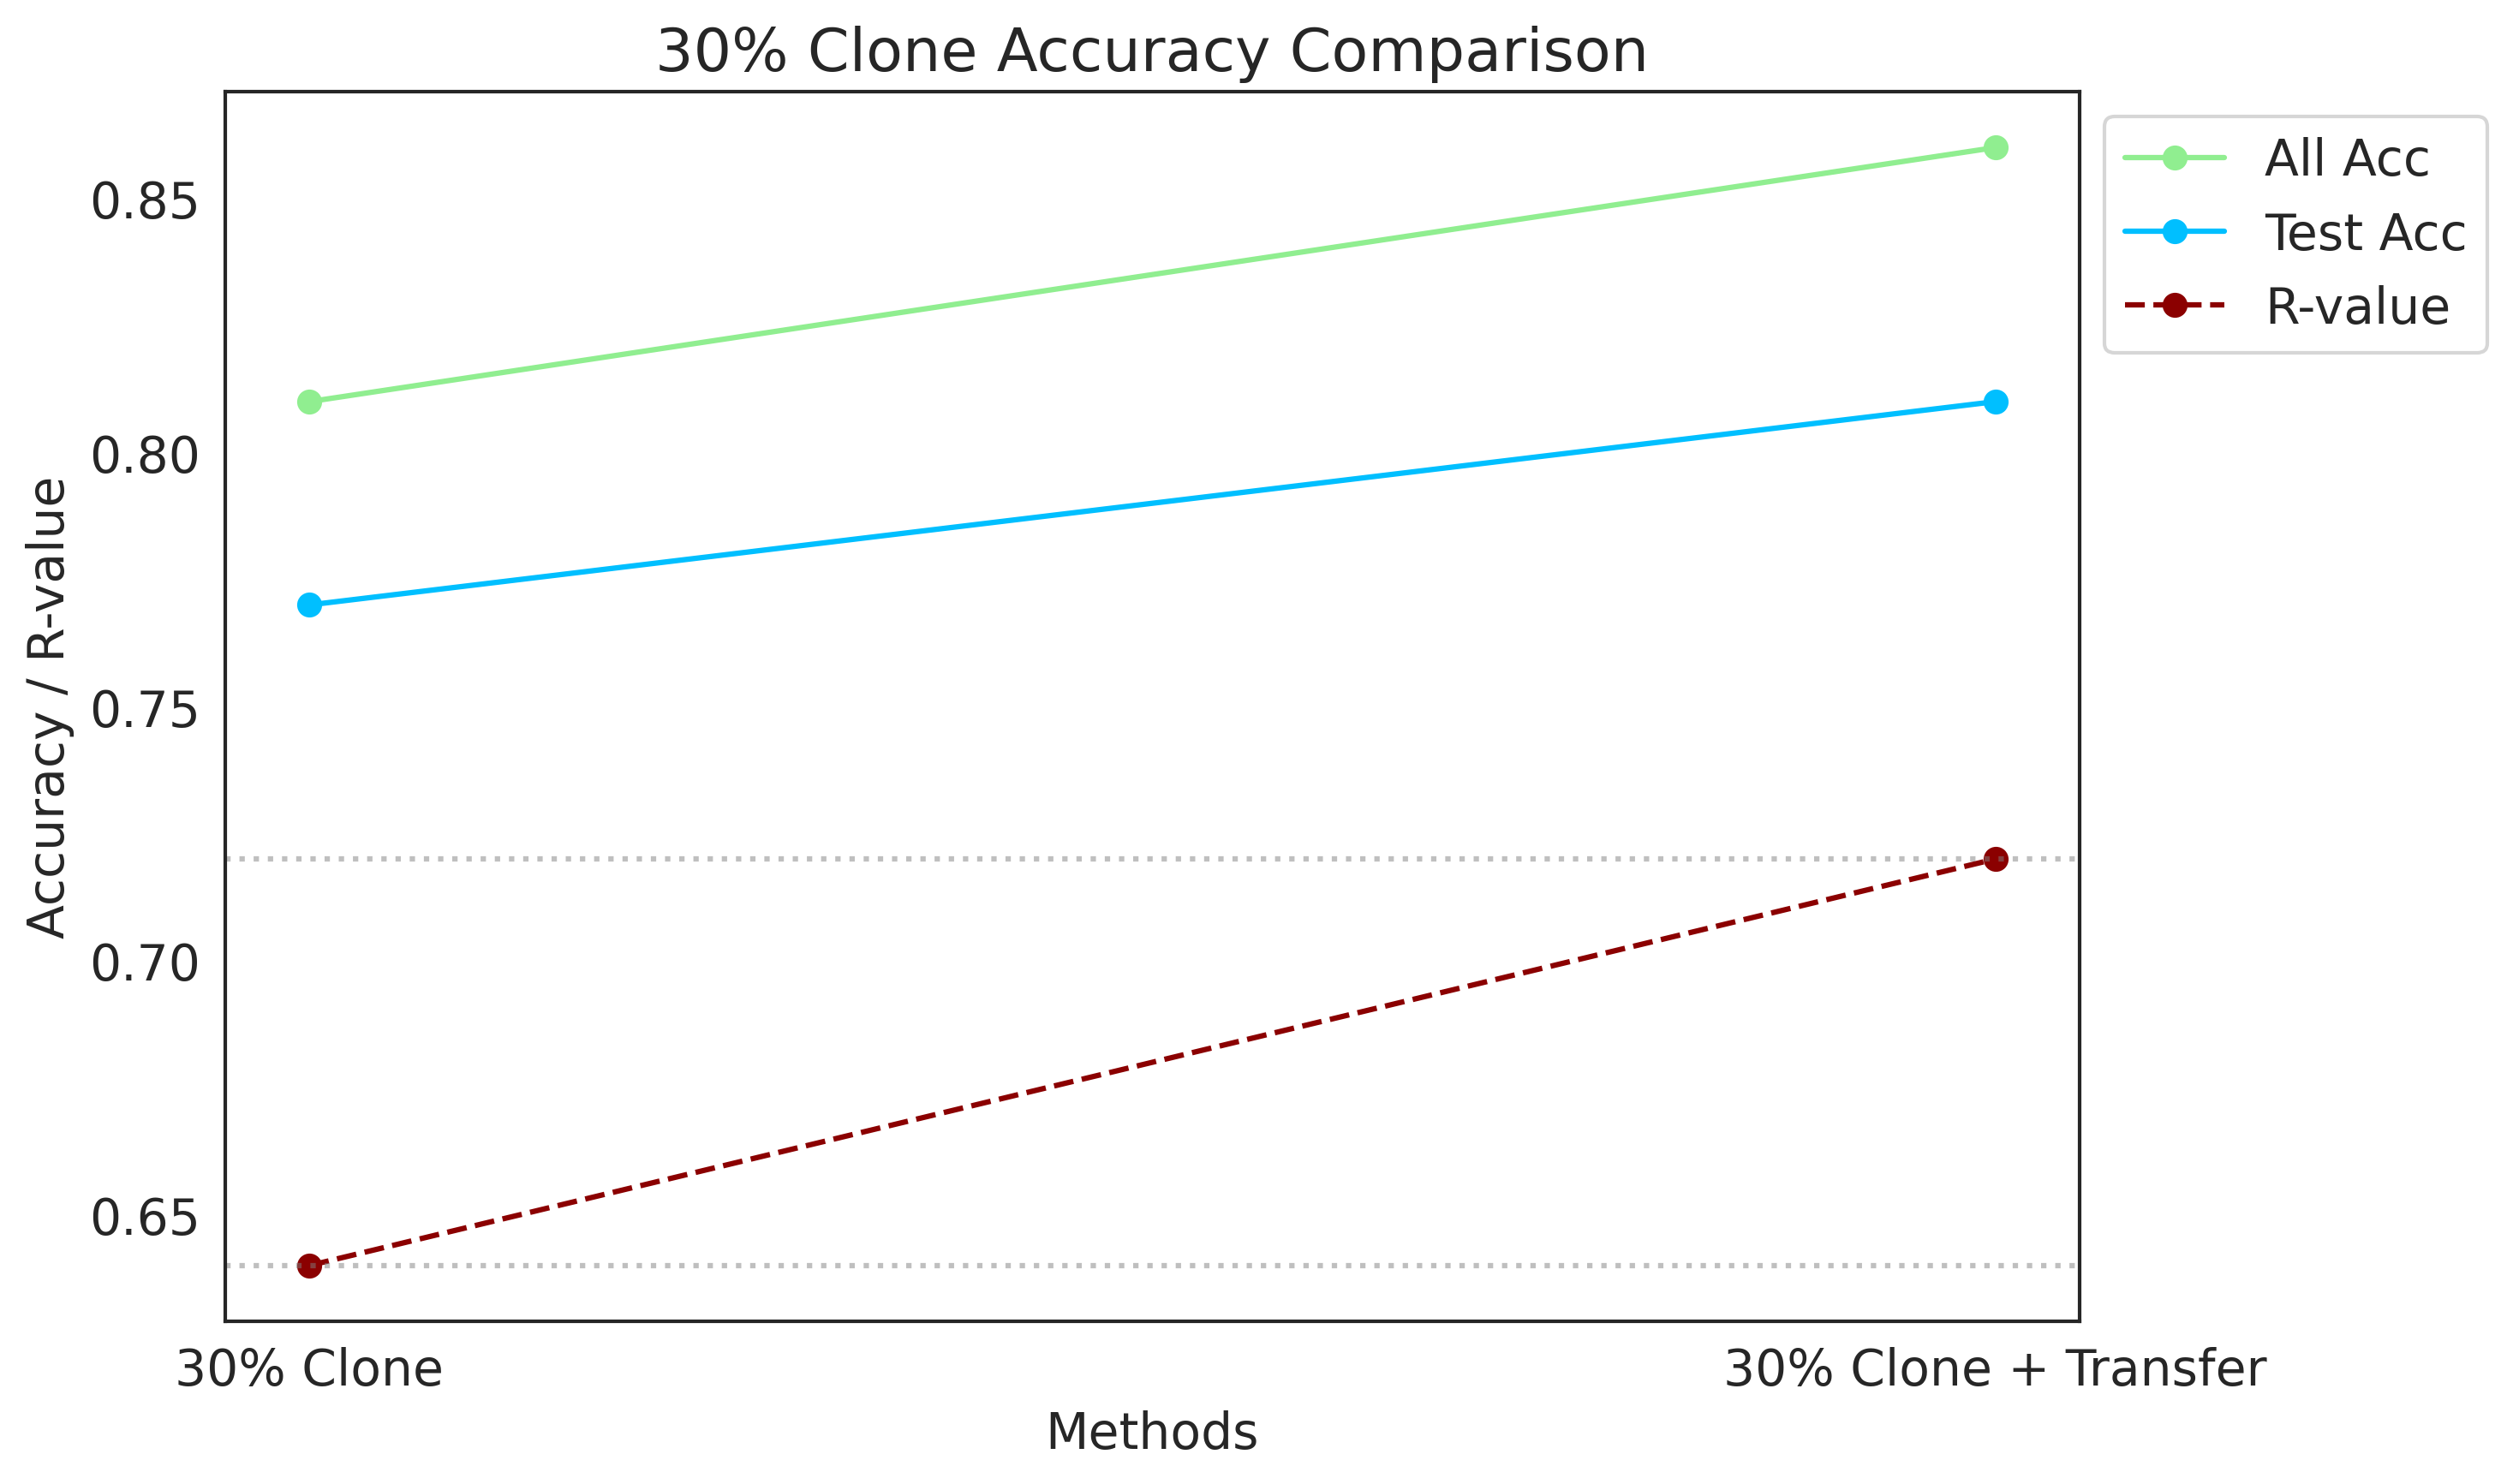
methods_30 = ["30% Clone", "30% Clone + Transfer"]
all_acc_30 = [0.81, 0.86]
test_acc_30 = [0.77, 0.81]
R_values_30 = [0.64, 0.72]
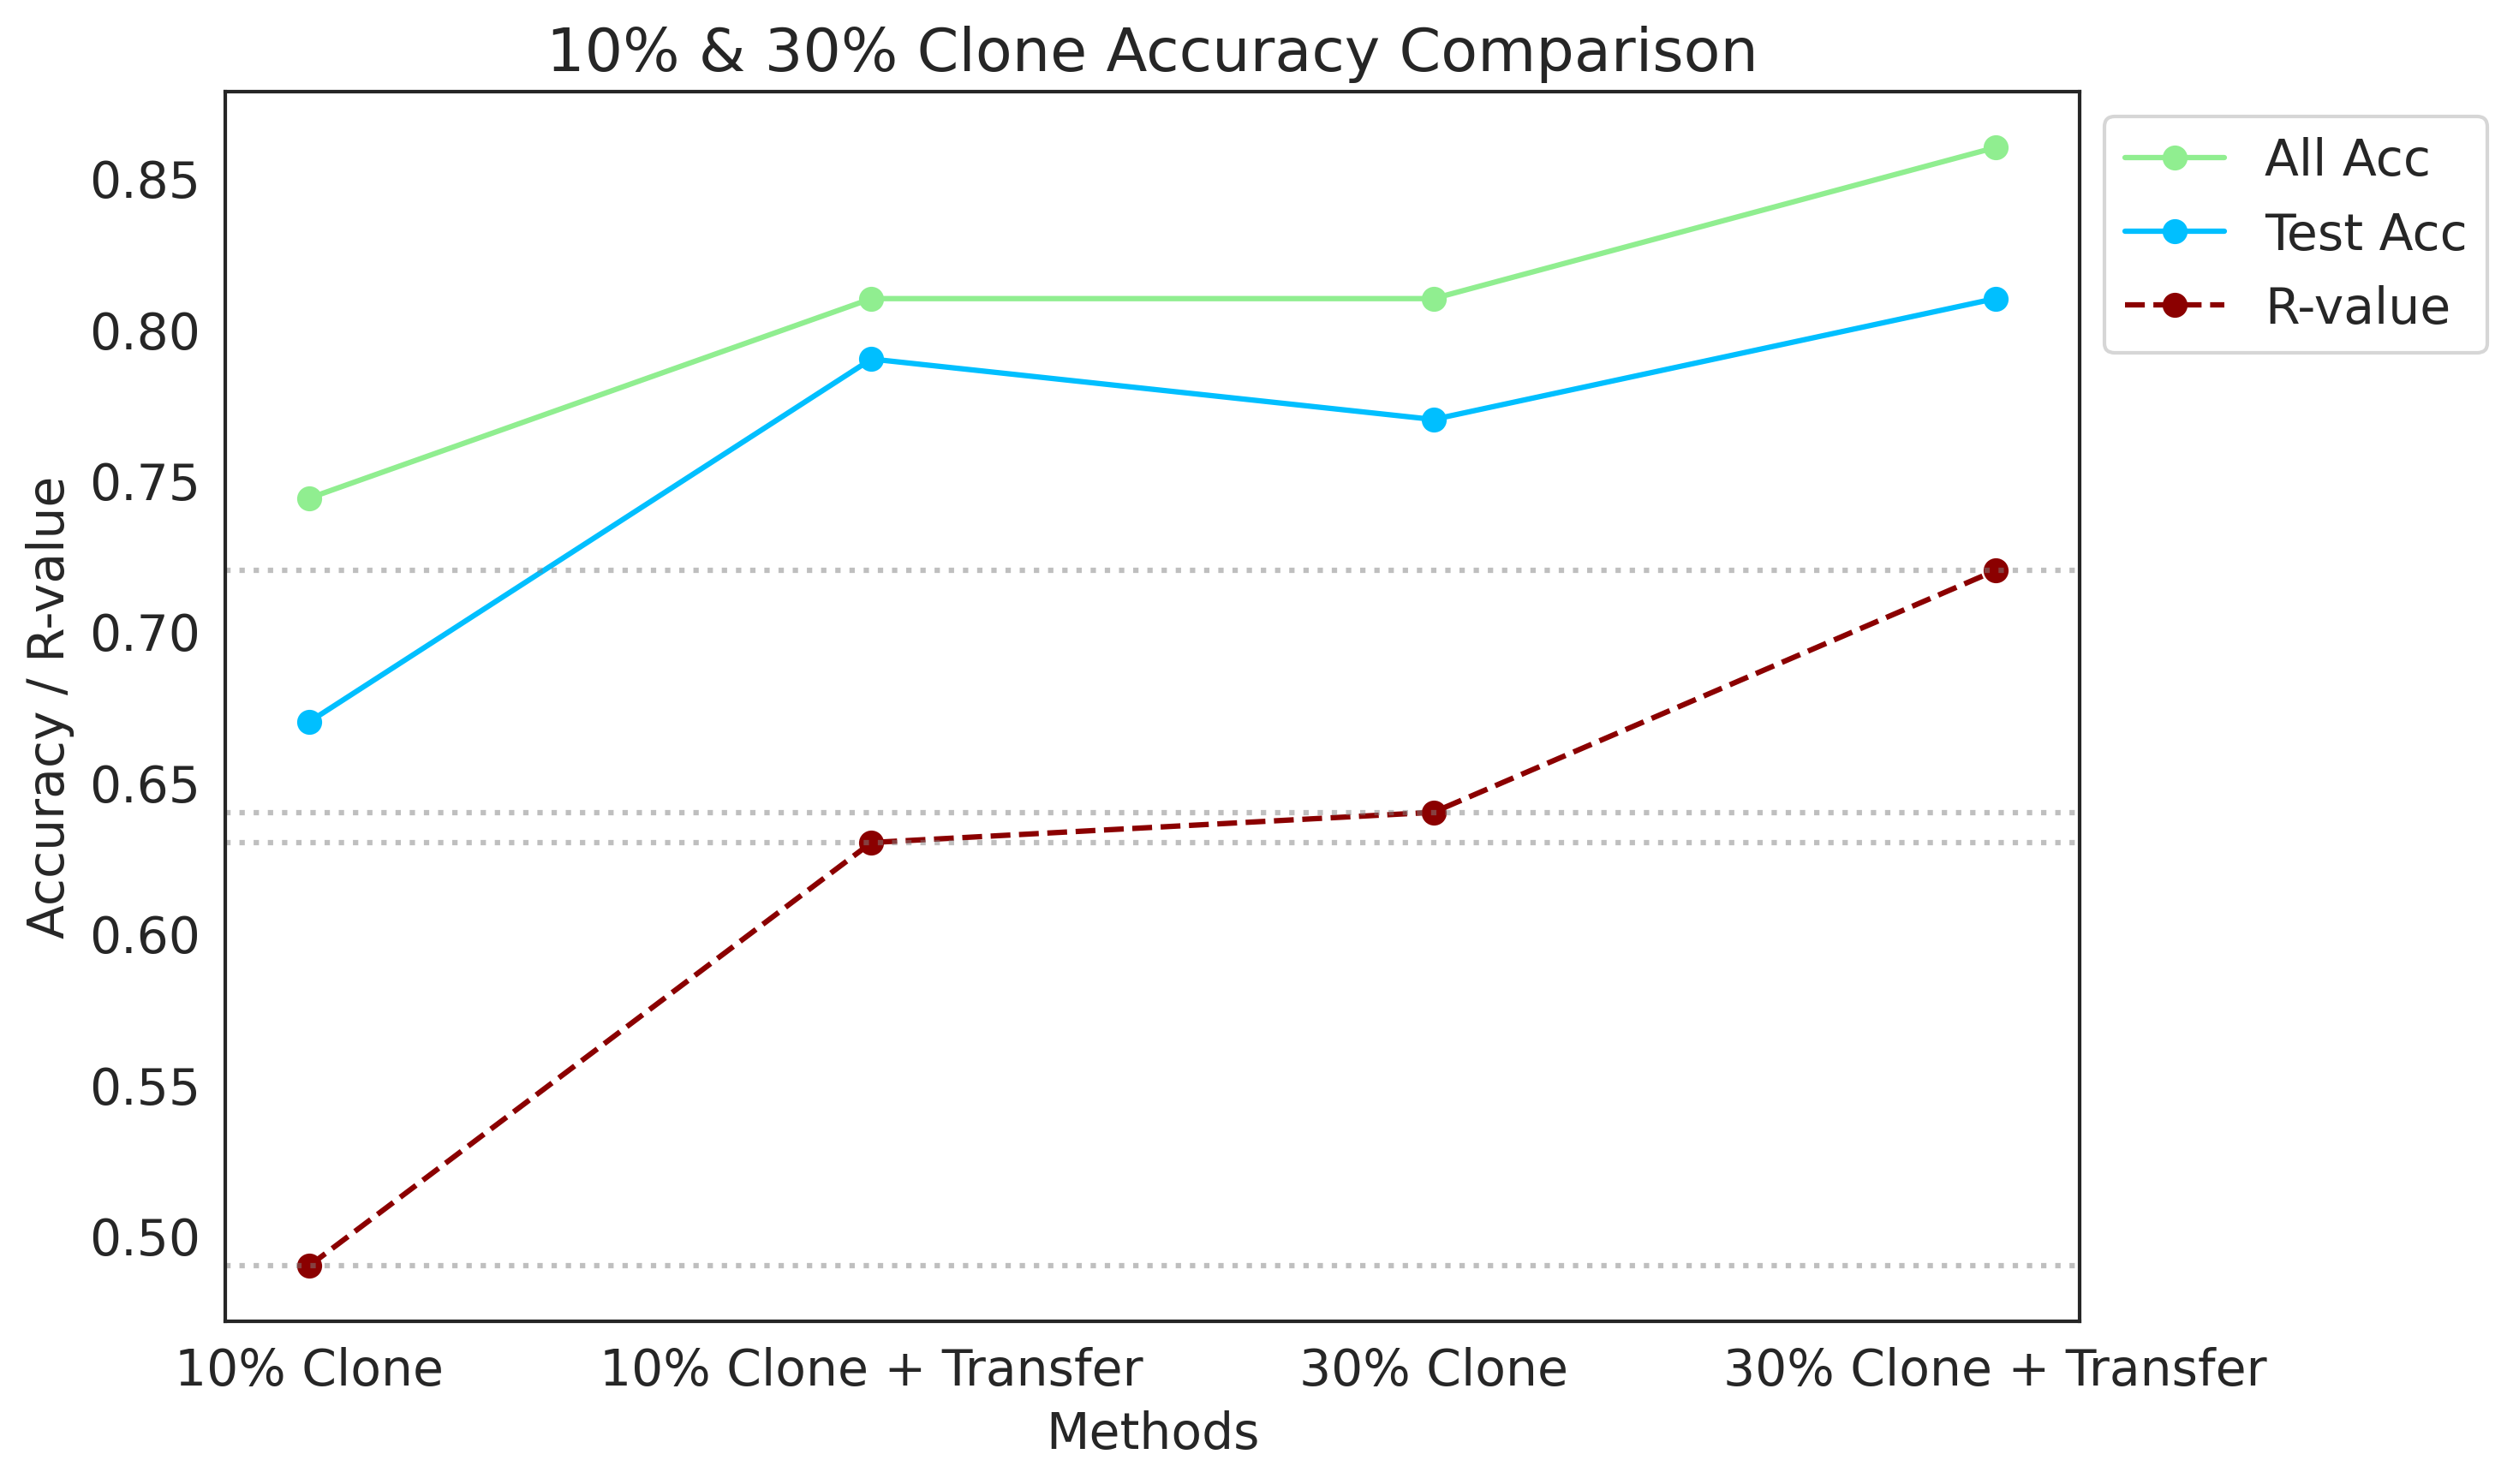
methods_combined = methods_10 + methods_30
all_acc_combined = all_acc_10 + all_acc_30
test_acc_combined = test_acc_10 + test_acc_30
R_values_combined = R_values_10 + R_values_30
colors = ['deepskyblue', 'lightgreen', 'darkred']
def plot_data(methods, all_acc, test_acc, R_values, title):
fig, ax = plt.subplots(figsize=(10, 6))
index = range(len(methods))
line1, = ax.plot(index, all_acc, marker='o', color=colors[1], label='All Acc')
line2, = ax.plot(index, test_acc, marker='o', color=colors[0], label='Test Acc')
line3, = ax.plot(index, R_values, marker='o', color=colors[2], label='R-value', linestyle='--')
for r in R_values:
ax.axhline(r, linestyle=':', color='gray', alpha=0.5)
ax.set_title(title)
ax.set_xlabel('Methods')
ax.set_ylabel('Accuracy / R-value')
ax.set_xticks(index)
ax.set_xticklabels(methods)
ax.legend(loc='upper left', bbox_to_anchor=(1, 1))
plt.tight_layout()
plt.show()
plot_data(methods_10, all_acc_10, test_acc_10, R_values_10, "10% Clone Accuracy Comparison")
plot_data(methods_30, all_acc_30, test_acc_30, R_values_30, "30% Clone Accuracy Comparison")
plot_data(methods_combined, all_acc_combined, test_acc_combined, R_values_combined, "10% & 30% Clone Accuracy Comparison")